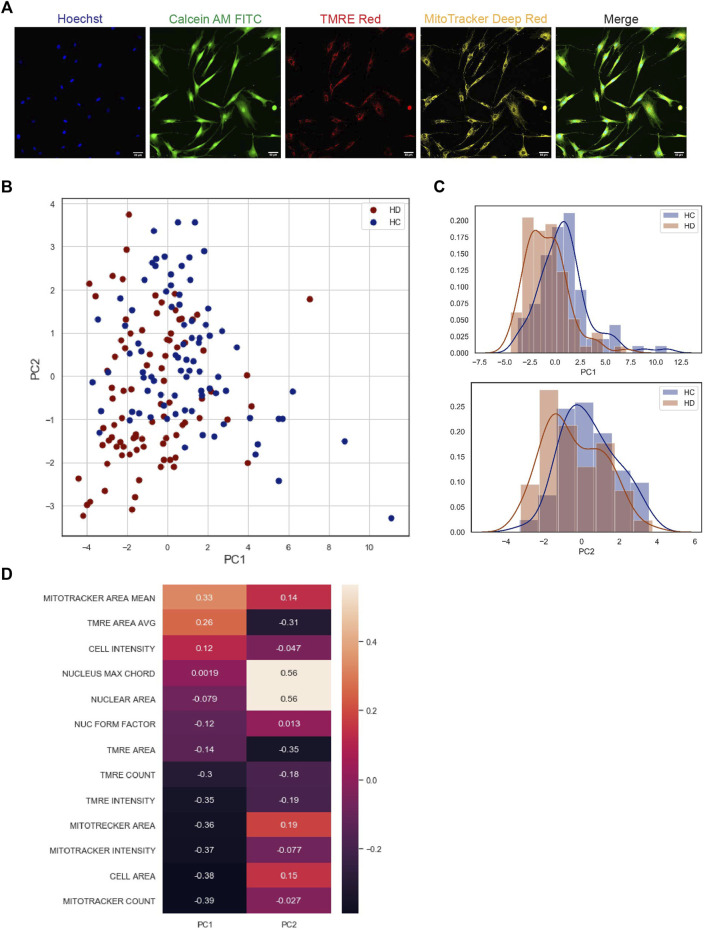
FIGURE 1.
High content image based analysis of primary skin fibroblast samples of HD patients compared to HC (A) Representative images of skin fibroblast cells stained with 4 different fluorescent vital dyes (Hoechst 22,342 to label the cell nuclei, Calcein AM to label cytoplasm of living cells, TMRE to label functional mitochondria, and Mitotracker far-red to label mitochondria). The images were acquired by 20x magnification using INCell 2200 image analyzer. Scale bar = 50 µm. (B) Principal component analysis of 12HD vs. 11HC phenotypic data (PCA graph on the right) The analysis shows a separation between the two groups. Each sample is represented by 6 circles each circle is the median of phenotypic data extracted from 20 fields coming from one well, each field contain 10–40 cells, blue circles represent HC samples, red circles represent HD samples. (C) (Histogram graphs on the right) represent the distribution of the analyzed PCA data of the two populations in the two dimensions (PC1, PC2), blue histogram represents HC and red histogram represents HD. (D) Plot of feature importance in the two PCA dimensions PC1 & PC2, organized from the most important (orange) to the least important feature (black) to the significant difference between the two populations in the PCA analysis.

