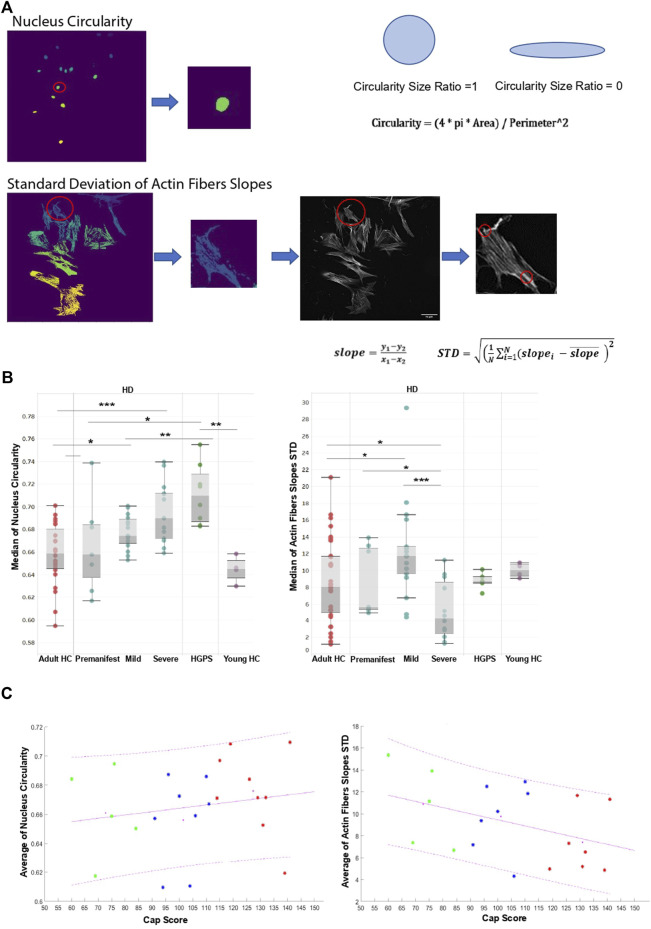
FIGURE 4.
An automatic image based high content analysis algorithm for actin cap like features (A) Schematic Representation of the segmentation steps for each feature. For the “Nucleus Circularity” feature the algorithm counts the total number of pixels constructing each nucleus segment over the nucleus image. A binary mask of each nuclear segment is generated and then used to measure the circularity. For the “Standard Deviation of Actin Fibers Slopes” feature, the algorithm segments the cell body (cytoplasm), and a binary mask is applied over the actin fibers image to receive an output image of actin fibers that overlap the specific cell’s cytoplasm. Then, an algorithm for line detection was applied on the output image in order to detect edge points couples of each actin fiber over the cytoplasm. For each actin fiber (“line”) over the cytoplasm, a linear slope was calculated, and a standard deviation value of all slopes was determined to assess the level of actin fibers parallelization over the cytoplasm (B) Mann-Whitney’s U test was performed on the medians of different actin cap like features generated from the image analysis tool mentioned above in HC fibroblast cells compared to the HD and HGPS per patient (20 HC, 6 Premanifest HD, 10 Mild HD, 12 Severe HD, 6 HGPS, 4 young HC), ∼500 cells from each skin fibroblast sample using GraphPad 8, the results are presented in box plots using Tableau 2020.3 (C) Trend analysis was performed on the average of different actin cap like features in relation to Cap Score of different HD samples divided into three groups (Premanifest in green, Mild in blue, and Severe in red). Magenta lines are represented as least squares lines (solid line - for the average of the data, dashed lines - for the maximum and the minimum of the data) Magenta points are an average point of each group presented in a plot using MATLAB R2021a.

