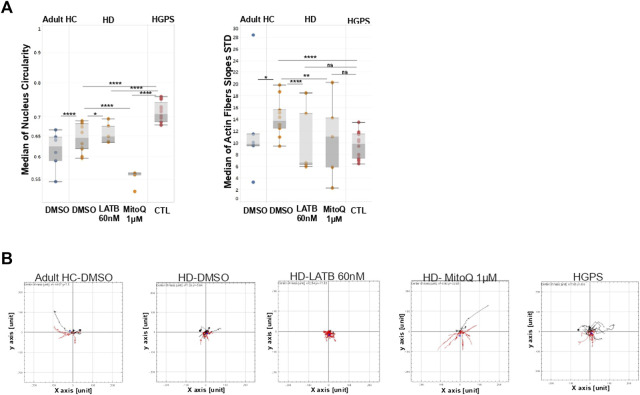
FIGURE 5.
Effect of MitoQ and Latrunculin B on the actin cap in HD Fibroblast compared to HC and HGPS (A) Mann-Whitney’s U test was performed on the medians of different actin cap like features generated from the image analysis tool mentioned above in HC fibroblast cells compared to the HD and HGPS per field (3 HC, 5 HD, 2 HGPS), ∼200 cells from each skin fibroblast sample using GraphPad 8, the results are presented in box plots using Tableau 2020.3 (B) Cell tracking analysis was carried out in the same conditions mentioned in materials and methods section. Sun plots show the cell path for representative ∼10 cells from each population. Graphs were generated by The Chemotaxis and Migration Tool (ImageJ plug-in).

