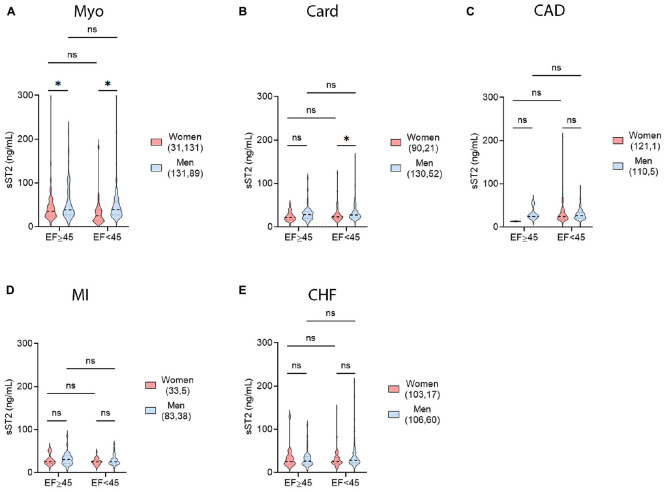
FIGURE 6.
Sex differences in LVEF and sST2. sST2 levels compared women (peach) vs. men (blue) with a left ventricular ejection fraction (LVEF) of ≥45% vs. <45% for (A) myocarditis (Myo), (B) cardiomyopathy (Card), (C) coronary artery disease (CAD), (D) myocardial infarction (MI), or (E) congestive heart failure (CHF). Violin plots denote data distribution for each group. One-way ANOVA: (A) p = 0.024, (B) p = 0.023, (C) p = 0.79, (D) p = 0.17, and (E) p = 0.36 with two-way comparisons analyzed using unpaired Student’s t-test: *, p < 0.05; ns, not significant. (A) Two-way ANOVA p-values indicate no interaction between EF and sex (p = 0.59) in patients with myocarditis, but interactions between LVEF and sST2 (p = 0.04) and sex and sST2 (p = 0.0036). (B) Two-way ANOVA p-values indicate no interactions between EF and sex (p = 0.81) or EF and sST2 (p = 0.22) in patients with cardiomyopathy, but interactions between sex and sST2 (p = 0.01). (C) Two-way ANOVA p-values indicate no interactions between EF and sex (p = 0.34), EF and sST2 (p = 0.48), or sex and sST2 (p = 0.40) in patients with CAD. (D) Two-way ANOVA p-values indicate no interactions between EF and sex (p = 0.77), EF and sST2 (p = 0.23), or sex and sST2 (p = 0.39) in patients with MI. (E) Two-way ANOVA p-values indicate no interactions between EF and sex (p = 0.21), EF and sST2 (p = 0.87), or sex and sST2 (p = 0.85) in patients with CHF.

