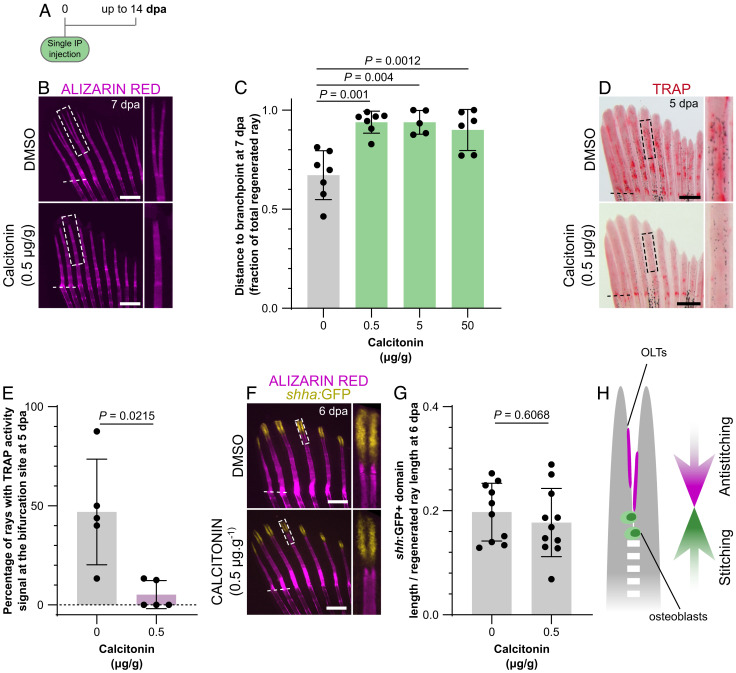
Fig. 5.
Inhibition of osteoclast activity impairs ray bifurcation. (A) Calcitonin treatment experimental protocol. (B and C) Stereomicroscope images of representative mineralized rays (B) and quantification (C) of the relative distance from the amputation plane to the branchpoint at 7 dpa, showing impaired bifurcation upon calcitonin treatment. Boxes in B represent the areas magnified on the Right. (D and E) Stereomicroscope images of representative TRAP-stained fins (D) and quantification of the percentage of rays displaying TRAP signal at the bifurcation site (E) at 5 dpa, showing reduced osteoclast activity upon calcitonin treatment. Boxes in D represent the areas magnified on the Right. (F and G) Confocal images of representative bifurcating rays showing segregation of the shha:GFP+ domains (F) and quantification of their extension (G), confirming that calcitonin effects are Shh-independent. Boxes in F represent the areas magnified on the Right. (H) Model highlighting the balanced stitching and antistitching activities of osteoblasts and OLTs to define the branchpoint position. The dots in the graphs represent individual zebrafish; all graphs show the mean ± SD. One-way ANOVA (P = 0.0057) and Tukey’s post hoc test in C; unpaired, two-tailed Student’s t test with Welch’s correction in E; unpaired, two-tailed Student’s t tests in F. (Scale bars: 500 µm.)

