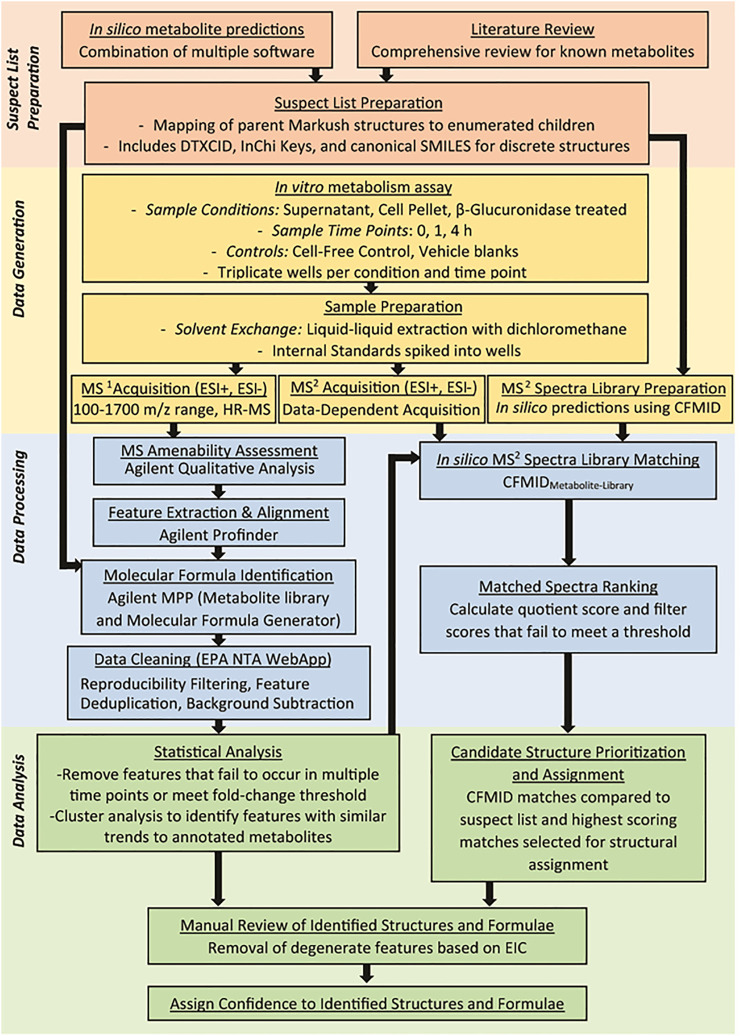
FIGURE 1.
Overall workflow of the NTA method developed to identify metabolites using in silico tools to guide data acquisition and analysis. Each colored section represents a significant step in the analysis workflow and include generation of the suspect screening list from in silico tools and literature review (red section), MS1 and MS2 analysis of metabolites generated by primary hepatocytes (orange section), processing of the data to clean the data and annotate features (blue section), and data analysis to characterize features that correspond to metabolites of the parent compound (green section).

