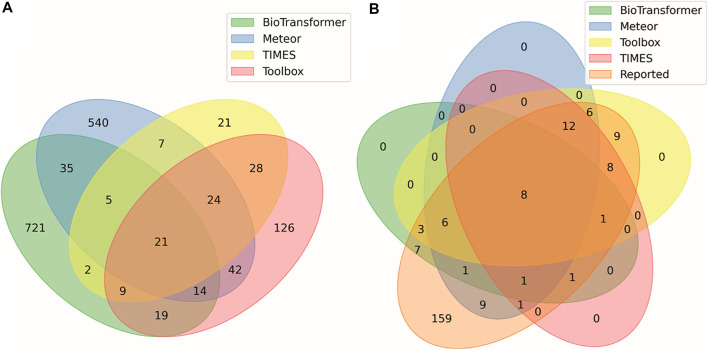
FIGURE 2.
Venn diagram displaying concordance between (A) all predicted metabolites and the in silico tools that generated the prediction, and (B) all metabolites reported in literature and in silico tools that generated those predictions. Numbers indicate how many metabolites match the conditions of each ellipse. For example, among the predicted metabolites in (A) there were 28 metabolites predicted by both TIMES (https://oasis-lmc.org) (Mekenyan et al., 2004), and QSAR Toolbox (https://qsartoolbox.org) (Dimitrov et al., 2016) but not by the other prediction methods. Among the metabolites reported in the literature in (B), only 8 of the 28 predicted by only TIMES and ToolBox were previously reported.

