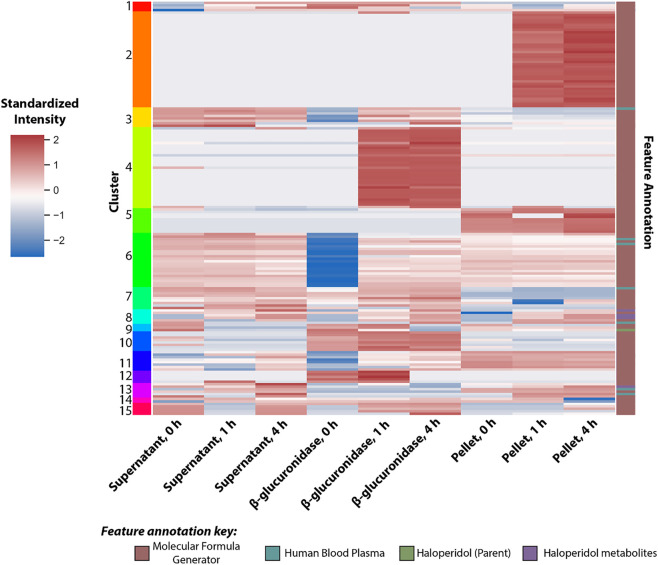
FIGURE 4.
Heat map of features identified in the haloperidol dataset. Each row represents a single feature extracted from the MS1 and standardized across all experimental conditions. Features were annotated using either Agilent’s molecular formula generator, a list of metabolites common to human blood plasma, or a list of metabolites related to haloperidol (including the parent structure). The annotation source for each feature is outlined by the right-most column. Features were also clustered into 15 groups (left-most column) based on their distribution across the experimental conditions via a K-means clustering algorithm.

