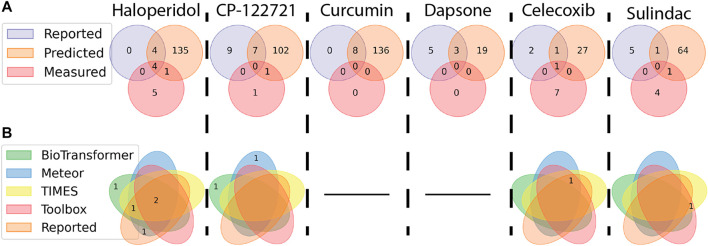
FIGURE 7.
Venn diagrams showing the distribution and similarity of metabolites identified from different sources. Numbers indicate how many metabolites match the conditions of each ellipse. (A) Similarity of metabolites are compared between features measured using the NTA method outlined in this work, reported in literature, and predicted by in silico tools. (B) Metabolites identified as part of the NTA were separated based on the source of the structure (a black line indicates no metabolites were identified via the NTA). Taking Haloperidol for example, four metabolites were reported in the literature, predicted in silico, and observed. Another four metabolites were reported and predicted, but not observed. One previously unreported metabolite was predicted and observed.

