
Fig. 1.
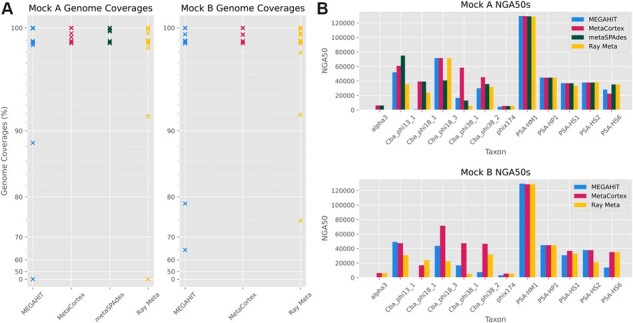
(A) Genome coverages for Mock A and Mock B for assemblies presented in Tables 1 and 2. Each cross indicates the assembled percent of a genome in the mock. A cross at 0% indicates that a known genome in the sample was not present in the assembly. (B) NGA50 by viral species for assemblies presented in Tables 1 and 2