
Fig. 3.
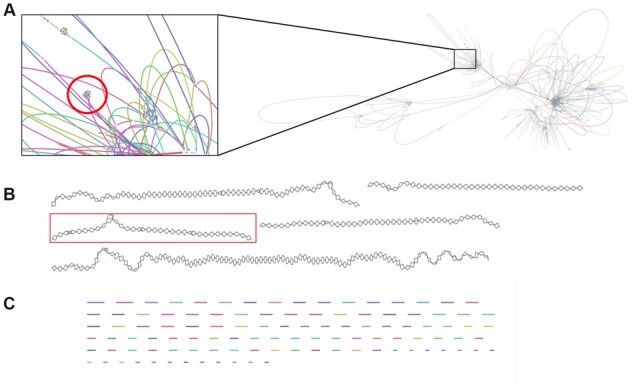
(A) Portion of assembly graph produced by metaSPAdes. Highlighted area shows sequences that mapped to the HIV reference genomes. (B) Portion of sequence graph produced by MetaCortex. Highlighted area represents the single contig that mapped to the HIV reference genomes. (C) FASTA output from Ray Meta represented as a sequence graph