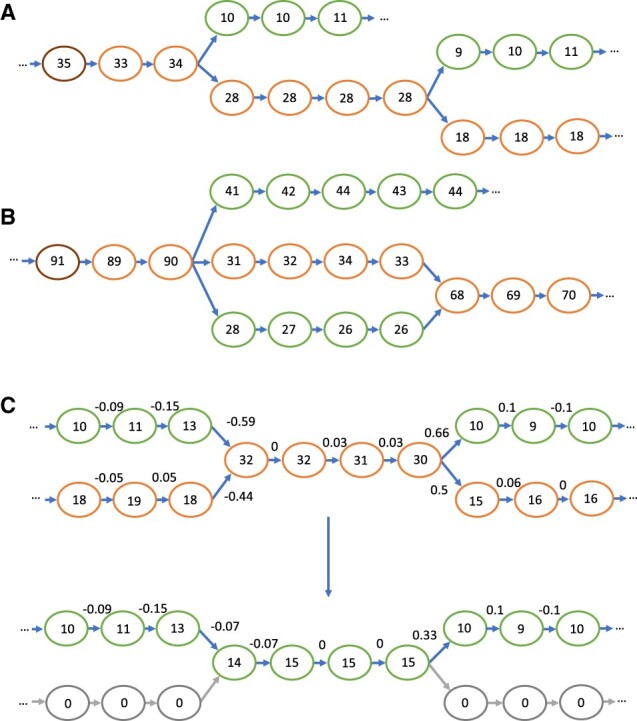
Fig. 5.

Depictions of de Bruijn graphs, with the coverage for each node represented. (A) The path chosen by MetaCortex Consensus, with the highest coverage node on the far left (highlighted in brown), and the chosen path following the lower edges of the graph (highlighted in orange). (B) The path chosen when two of the branches form a bubble. Because the two bubble branches, added together, represent a combined higher coverage than the top branch, a route through the bubble is selected for the path. (C) The progression of the SW algorithm. The numbers above the edges are the normalized coverage difference/delta. The first graph is before coverage subtraction, with the path chosen again following the lower edges of the graph (highlighted in orange). The second graph is after coverage subtraction. Nodes belonging to exactly one path are removed (now with coverage 0, shown in grey), whilst nodes that are shared between paths remain with reduced coverage. (A color version of this figure appears in the online version of this article)
