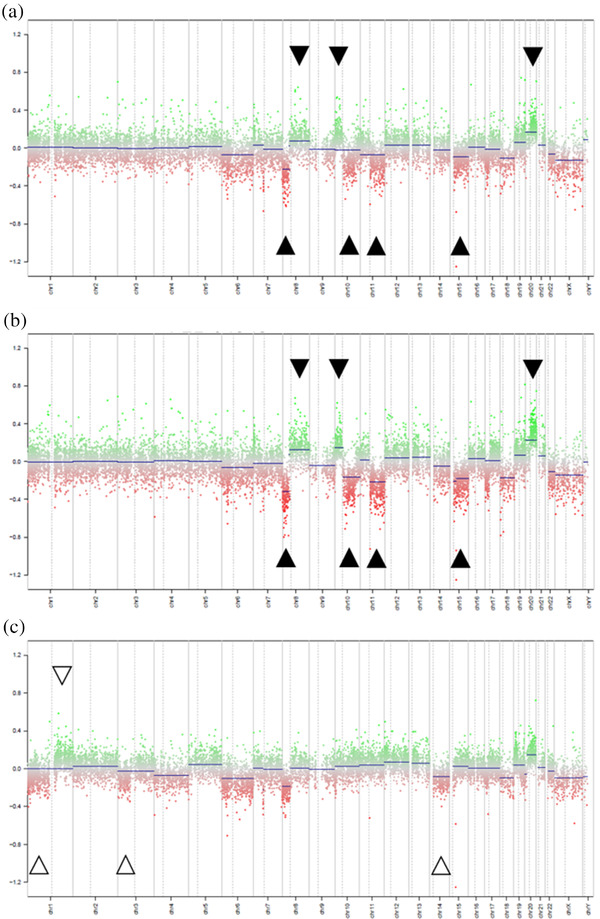
FIGURE 4.

In conumee plots, analysis of the Infinium Methylation EPIC array showed that the copy number profiles for the endoscopic submucosal dissection lesion (a), and the recurrent tumor (b) were practically identical, sharing 8p loss, 8q gain, 10p gain, 10q loss, 11q loss, 15q loss, and 20q gain. In contrast, the cecal cancer (c) showed 1p loss, 1q gain, 3p loss, and 14q loss, which were not observed in A and B, while 10p gain, 10q loss, 11q loss, and 15q loss were absent.
