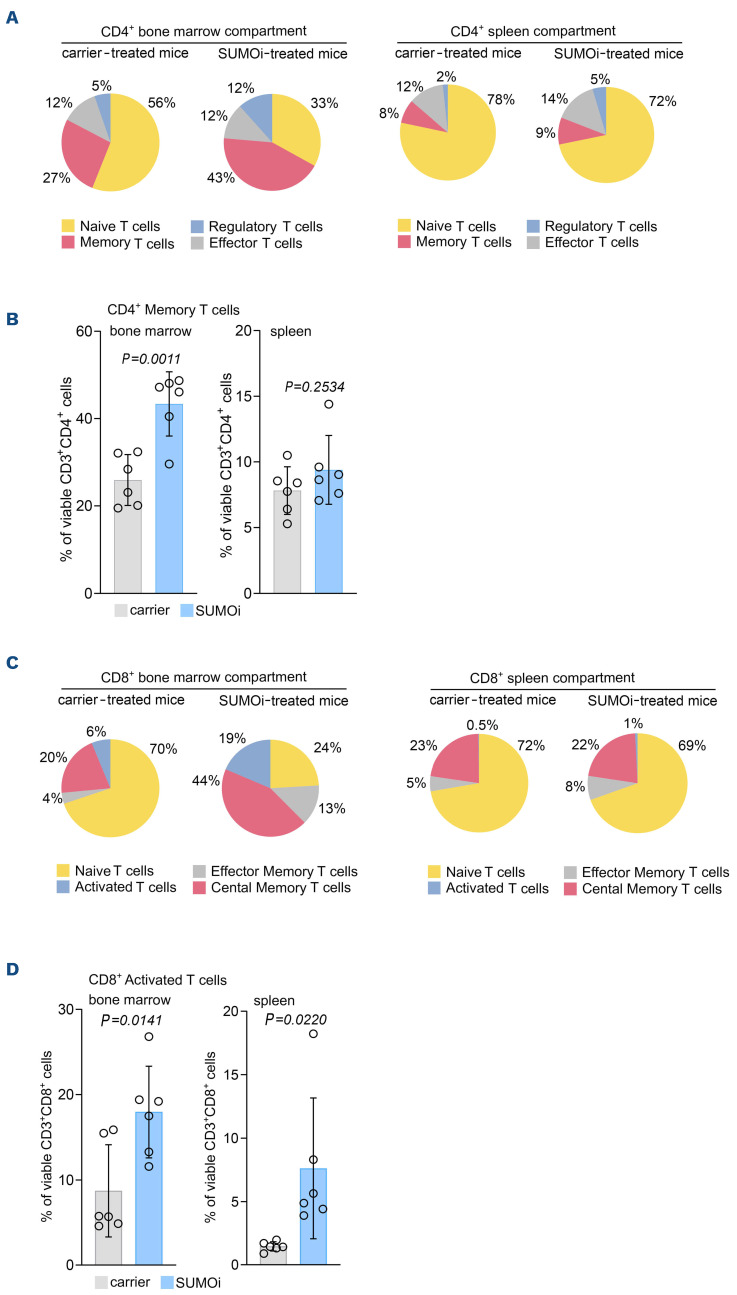
Figure 4.
SUMO inhibition remodels the T-cell compartment towards a memory and activated T-cell phenotype. (A) Experimental setup as outlined in Figure 3A. Pie charts representing the frequencies of the indicated cell populations in the CD3+CD4+ bone marrow (BM) and spleen compartment (CD3+CD4+CD44lowCD62L+ naïve T cells, CD3+CD4+CD44highCD62L- memory T cells, CD3+CD4+CD44lowCD62L- effector T cells, CD3+CD4+CD25+CD69+FoxP3+ regulatory T cells). (B) Percentage of memory T cells (CD3+CD4+CD44highCD62L-) of the CD3+CD4+ BM and spleen cells. N=6, P values were determined by unpaired t-test. (C) Pie charts representing the frequencies of the indicated cell populations in the CD3+CD8+ BM and spleen compartment (CD3+CD8+CD44lowCD62L+ naïve T cells, CD3+CD8+ CD44highCD62L- effector memory T cells, CD3+CD8+CD44highCD62L+ central memory T cells, CD3+CD8+CD25+CD69+ activated T cells) after carrier vs. SUMOi treatment. (D) Percentage of activated T cells (CD3+CD8+CD25+CD69+) of the CD3+CD8+ BM and spleen cells. N=6, P values were determined by unpaired t-test.

