Figure 5.
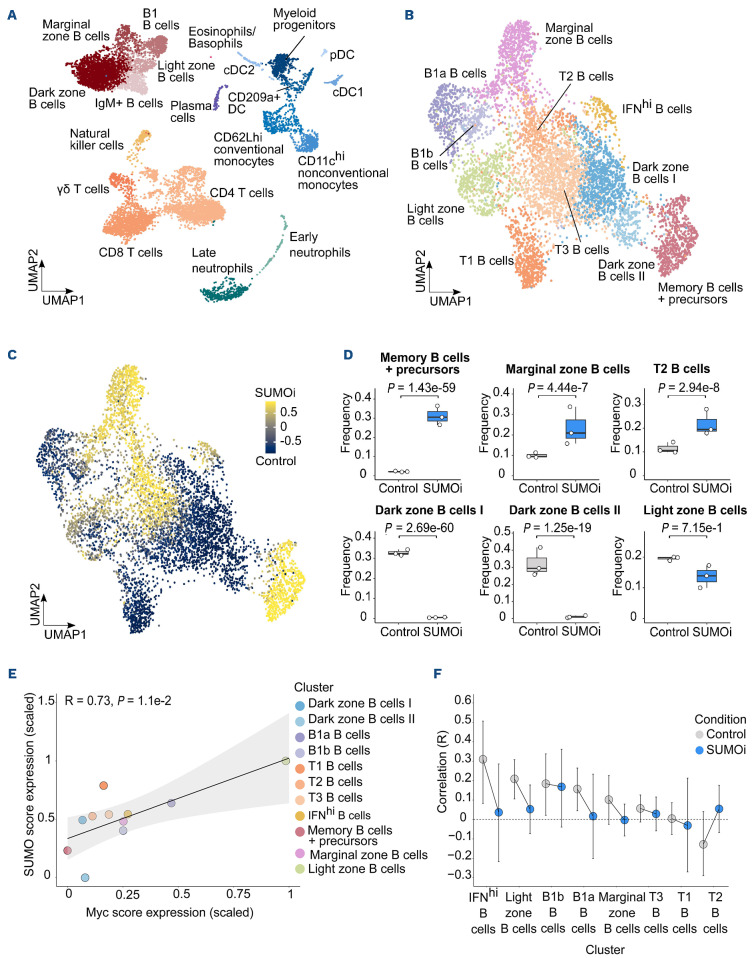
SUMO inhibition substantially alters the normal B-cell landscape. (A) UMAP visualization of spleen scRNA-sequencing data from control and SUMO inhibitor (SUMOi)-treated mice (subasumstat 7.5 mg/kg on day 1 and 4, spleen cell analysis day 5; dataset GSE193359). (B) B-cell populations identified in (A) were subsetted and reclustered. The UMAP visualization represents B cells from both conditions. (C) Differentially abundant B-cell populations in control and SUMOi-treated mice identified with DA-seq. Cells are colored by DA-seq measure. Yellow = more abundant after SUMOi challenge. Dark blue = more abundant after control treatment. (D) Differential abundance testing on mouse-wise pseudobulks (indicated by white dots, n=3). Bar plots represent the subpopulation frequencies stratified by condition. The median is indicated by the center line of the box plot. The box extends from the 25th to 75th percentiles, whisker length reaches from minimum to maximum. Significance is determined by a Negative Binomial Generalized Linear Model. (E) SUMO and MYC score correlation analysis in control mice. Scaled mean expression values are plotted against each other for each cell population identified in (B). R indicates the Pearson correlation coefficient. The regression line is shown in black. The grey area indicates the 95% confidence interval. (F) SUMO and MYC score correlation analysis in control and SUMOi-treated mice. For each population the Pearson correlation coefficient (R) is plotted. Black bars indicate the range of the 95% confidence interval. The dashed black line at R=0 is a reference line and plotted as a visualization aid.

