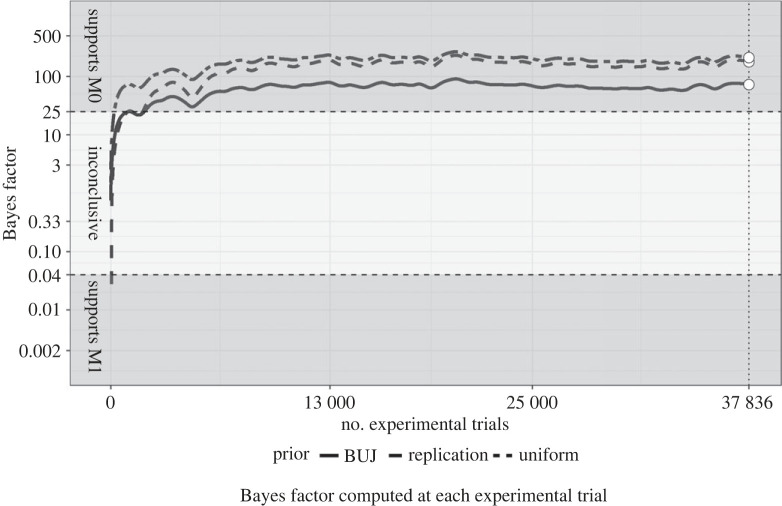
Figure 1.
The figure shows cubic splines fit over Bayes factor values computed at each experimental trial. The solid, dashed and two-dashed lines represent the Bayes factors computed with the BUJ prior, replication prior and the uniform prior respectively. The dashed horizontal lines represent the predetermined thresholds for supporting M0 and M1. The dotted vertical line indicates the stopping points, where the Bayes factors were checked against the stopping criteria. The figure indicates that the Bayes factors using all three pre determined priors passed the BF01 > 25 threshold. This threshold has been passed relatively early during data collection, and the Bayes factors remained above the threshold throughout the rest of the study.

