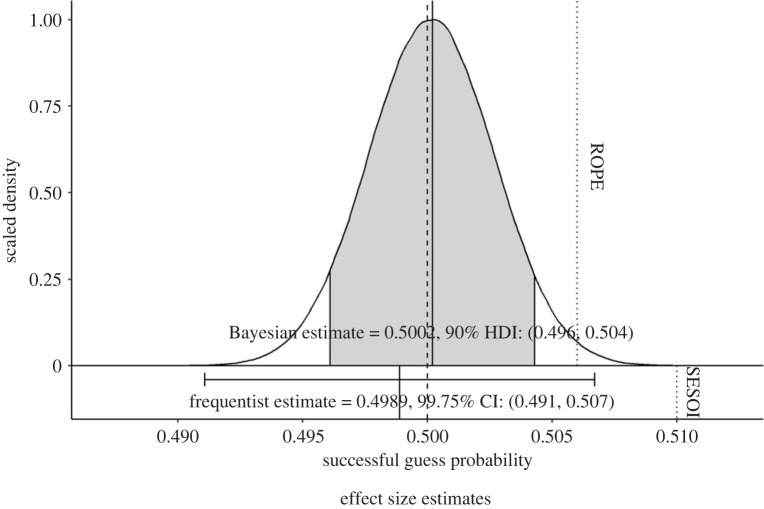
Figure 2.
The figure shows the results of the mixed effect logistic regression (bottom) and the Bayesian parameter estimation robustness test (top). The density curve shows the posterior distribution derived from the Bayesian parameter estimation analysis with the 90% highest density interval (HDI) overlayed in grey. The horizontal error bar represents the 99.75% confidence interval (CI) derived from the mixed effect logistic regression in the primary analysis. Both of these are interval estimates for the probability of correct guesses in the population. The dashed vertical line represents 0.5 probability of correct guess chance, the dotted vertical line on the top represents the threshold of the region of practical equivalence (ROPE) used in the Bayesian parameter estimation (0.506), while the dotted vertical line on the bottom represents the threshold of the equivalence test (smallest effect size of interest, SESOI) used in the mixed effect logistic regression (0.51). The figure indicates that both the Bayesian parameter estimation and the frequentist mixed model support the null model, with the estimates very close to 50%, and falling well below 51% correct guess probability.

