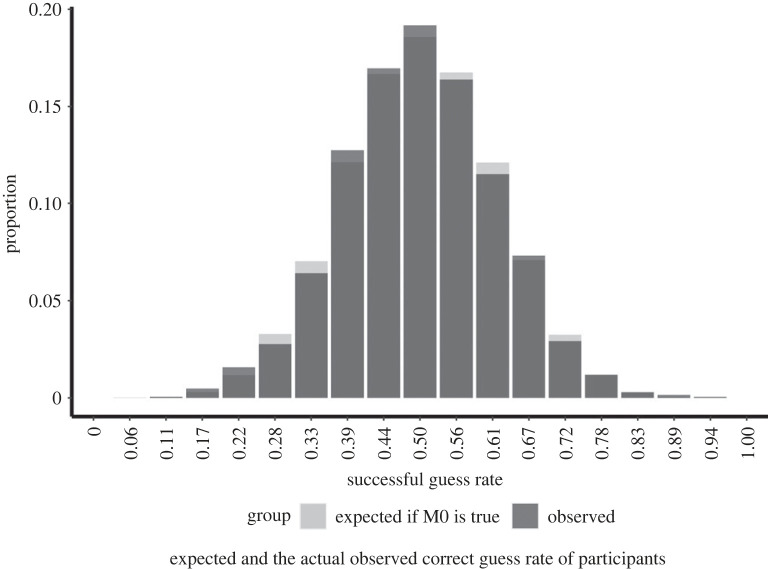
Figure 3.
The figure displays the expected (light grey) and the actual observed (dark grey) correct guess rate of participants. The distribution of the expected guess rate was determined by drawing 18 000 000 samples (1 000 000 simulated participants) from a simulated population where the probability of successful guesses was set to 0.5, and the success rates in this sample were calculated. The figure does not show a substantial deviation between the expected and the observed distribution of successful guess rates, which lends further support to the hypothesis that participants guessed at chance (50%) accuracy in this task, and that there are no subgroups of unexpectedly lucky or talented (sheep) or unexpectedly unlucky (goats) participants in the population.

