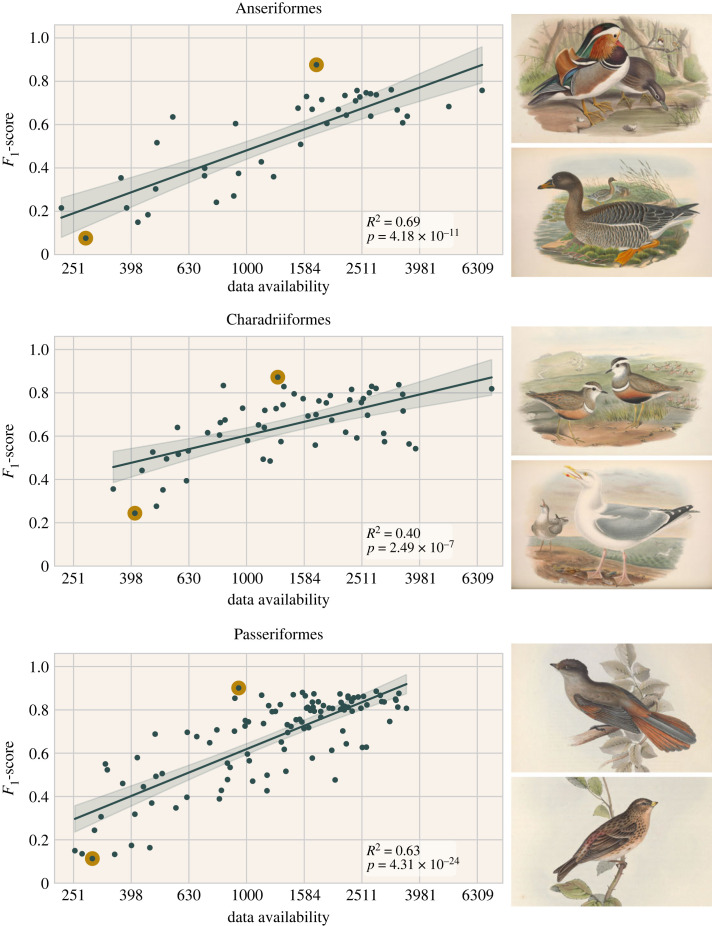
Figure 1.
Effect of the total data availability per species on their F1-scores, in models trained with 200 documented observations, for three bird orders. The top- and bottom-performing species per order (highlighted dots) are depicted, see electronic supplementary material, table S1. Regressions are ordinary least squares with 95% CIs.

