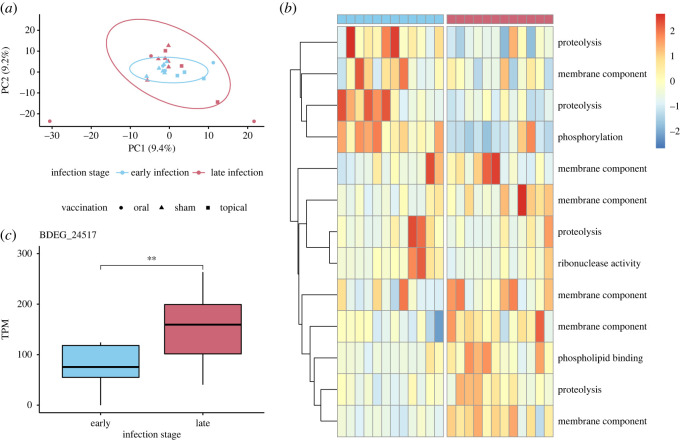
Figure 6.
Bd gene expression varies by infection stage. (a) Principal components analysis of Bd gene expression in early and late infection summarized by Log2 transformed counts per million mapped reads. Ellipses indicate 95% CI for expression in early and late infection. (b) Heatmap of functionally annotated DEGs in early and late infection (FDR-corrected p < 0.05). Expression is summarized by scaled and centred z-scores of Log2 average TPM. Each row represents one DEG, and each column represents Bd function in a single animal in early or late infection. Columns headed in blue (left) represent Bd gene expression in early infection and columns headed in pink (right) represent Bd gene expression in late infection. (c) The expression of putative pathogenesis-associated gene BDEG_24517 is expressed significantly higher in late infection.

