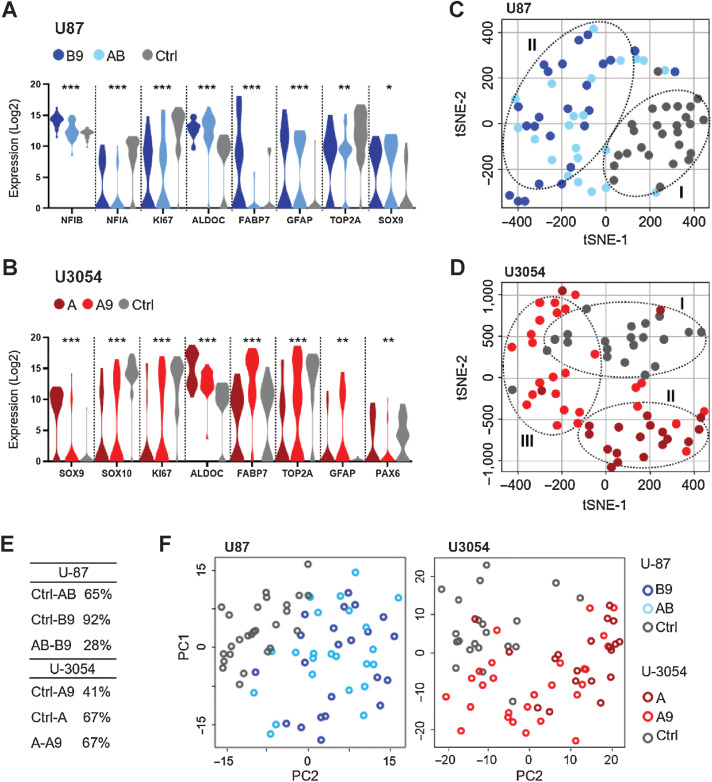
Figure 3.
Conversion induces gene expression changes resulting in distinct populations. A and B, Violin plot of gene expression for selected differentially expressed genes presented in the order of P values for U87 and U3054. Corrected ANOVA *, P < 0.05; **, P < 0.01; ***, P < 0.001. C and D, Integrated tSNE analyses of Fluidigm gene expression data from single cells. Note two distinct cell populations for U87 and three for U3054. E, ANOVA pairwise summary of gene expression: percentage of differentially expressed genes (genes with P < 0.05) between all experimental groups taken in pairs. F, PCA of single-cell qPCR data from U87 and U3054 confirms cluster segregation of treated and untreated cell groups for both U87 and U3054. For each experimental group 20 < n < 25 cells were analyzed.

