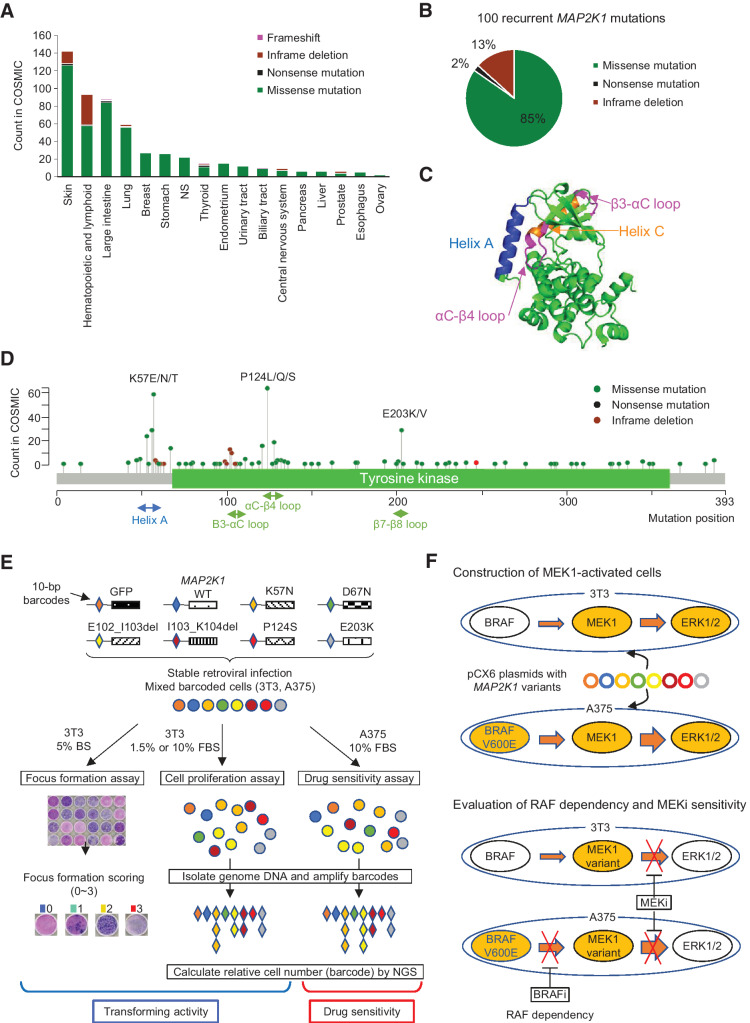
Figure 1.
Spectrum of MAP2K1 variants, the structure of the MEK1 protein, and a schematic overview of the MANO method. A, Patterns of MAP2K1 mutations in various cancers. The bar charts illustrate the number of tumor samples with MAP2K1 mutations in the COSMIC database for each cancer type. Mutation types are coded in green (missense mutation), black (nonsense mutation), light green (inframe deletion), and pink (frameshift). B, Circle chart showing the percentage of MAP2K1 mutation types selected in this study. C, Categorization of MEK1 mutations in the crystal structure location. Helix A (blue), Helix C (orange) as well as β3-αC loop and αC-β4 loop (pink) are highlighted. D, Distribution of MAP2K1 mutations detected in the COSMIC database. E, Schematic representation of the MANO method. 3T3 cells and A375 cells were infected with recombination retrovirus-expressing MAP2K1 variants with individual 10 bp barcodes. The transforming activity of MAP2K1 variants in 3T3 cells was evaluated using a focus formation assay. Equal numbers of stabilized, transduced cells were mixed and cultured with two types of medium in 3T3 cells or treated with drugs in A375 cells. Genomic DNA was extracted from the cells at the end of each experiment. The barcode sequences were PCR-amplified and subjected to deep sequencing to quantitate the relative abundance. F, Construction of MEK-dependent cells and evaluation of MEKi sensitivity against MEK1 variants. Both cell lines were transfected with MAP2K1 variants by retrovirus using pCX6 plasmid to generate MEK-dependent cell lines. MEK1-dependent 3T3 cells were assessed for drug sensitivity and RAF dependency, and sensitivity to MEKis was evaluated in A375 cells transfected with MAP2K1 variants, with or without RAF inhibitors.

