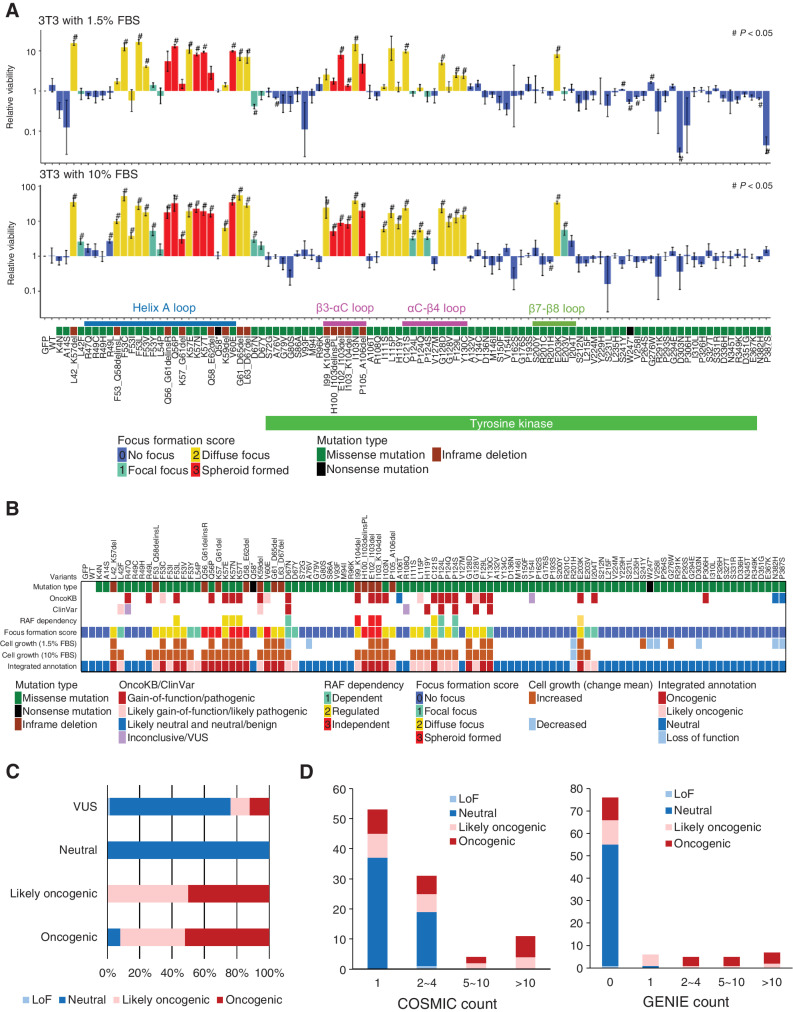
Figure 2.
Transforming activity and functional annotation of MAP2K1 variants. A, Fold change from day 0 to day 14 (10% FBS; bottom) or day 17 (1.5% FBS; top) of 3T3 cells with respective MAP2K1 variants in the mixed cell population was computed using the MANO method and shown on a logarithmic scale as relative proliferation. Mutations with a relative proliferation significantly different from GFP (#) are shown (paired t test, P < 0.05). The color of the bars indicates the FFS based on the focus formation assay and sorted according to the amino acid position. The error bars quantify the mean fold change across the three replicates and indicate the standard error. B, For each of 100 MAP2K1 variants (at the top of this figure), the mutation types and clinical significance annotated in OncoKB and ClinVar databases are presented in the top three rows. Below that, RAF dependency is shown according to Y. Gao and colleagues (41). Cell growth (1.5% or 10% FBS) is shown by increased (brown) and decreased (light blue) mutations (#) with significant differences in the cell growth assay (shown in Fig. 3A), respectively. C, The oncogenicity evaluated by the method is compared with that of OncoKB. OncoKB annotations are shown below the stacked bar chart. D, The results of the focus formation assay and growth competition assay by the MANO method were summarized to annotate the oncogenicity of the variants according to the classification described in the method. The oncogenicity evaluated by this method is compared with the variant count number of COSMIC or AACR Project GENIE. Error bars indicate SD.

