. 2022 Nov 28;22(2):227–239. doi: 10.1158/1535-7163.MCT-22-0302

Figure 3.

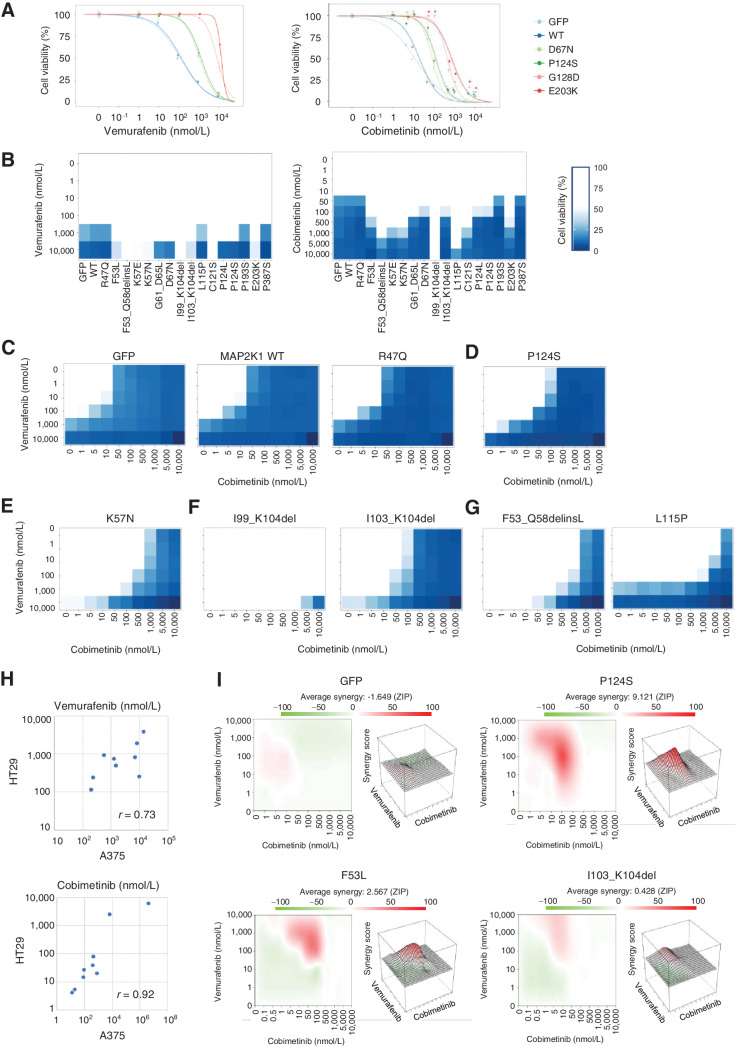
Figure 3. The individual sensitivity of MAP2K1 variants to combination therapy of BRAF and MEKi in A375 cells. A, A375 cells transduced with 4 MAP2K1 variants, WT, and GFP were treated with DMSO, a BRAF inhibitor (vemurafenib, right) or a MEKi (cobimetinib, left) at the concentrations indicated for 5 days. Cell viability was measured using the PrestoBlue cell viability assay. The relative viability of the treated cells was measured in comparison with drug-free treatment. Data were plotted as the mean ± SD (n = 3). B, A375 cells transduced with 16 variants, WT, GFP were treated with DMSO, BRAF inhibitor (left) or MEKis (right) for 5 days. The relative viability of the results is illustrated using color shading heatmap compared with drug-free treatment. Data were plotted as the mean ± SD (n = 3). C–G, Results of cell viability assay using combination treatment with two drugs at different concentrations for each individual variant color shading heatmap. C, Parental (GFP) and no function. D, RAF-dependent. E, RAF-regulated. F, RAF-independent. G, others. H, The variant sensitivities evaluated in A375 and HT-29 were well correlated (r = 0.73 for vemurafenib and r = 0.92 for cobimetinib). I, the synergistic effect of the combination therapy of vemurafenib and cobimetinib, and the average synergy of the four variants of GFP, P124S, F53L, and I103_K104del were calculated (Materials and Methods). Those with high synergy are highlighted in red in the 2D figure on the left and are highly represented in the 3D landscape on the right.

The individual sensitivity of MAP2K1 variants to combination therapy of BRAF and MEK inhibitors in A375 cells. A, A375 cells transduced with four MAP2K1 variants, WT, and GFP were treated with DMSO, a BRAF inhibitor (vemurafenib, right), or a MEKi (cobimetinib, left) at the concentrations indicated for 5 days. Cell viability was measured using the PrestoBlue cell viability assay. The relative viability of the treated cells was measured in comparison with drug-free treatment. Data were plotted as the mean ± SD (n = 3). B, A375 cells transduced with 16 variants, WT, and GFP were treated with DMSO, a BRAF inhibitor (left), or MEKis (right) for 5 days. The relative viability of the results is illustrated using color shading heatmap compared with drug-free treatment. Data were plotted as the mean ± SD (n = 3). C–G, Results of cell viability assay using combination treatment with two drugs at different concentrations for each individual variant color shading heatmap. C, Parental (GFP) and no function. D, RAF dependent. E, RAF regulated. F, RAF independent. G, Others. H, The variant sensitivities evaluated in A375 and HT-29 were well correlated (r = 0.73 for vemurafenib and r = 0.92 for cobimetinib). I, The synergistic effect of the combination therapy of vemurafenib and cobimetinib, and the average synergy of the four variants of GFP, P124S, F53L, and I103_K104del were calculated (Materials and Methods). Those with high synergy are highlighted in red in the 2D figure on the left and are highly represented in the 3D landscape on the right.