. 2022 Oct 10;21(2):170–186. doi: 10.1158/1541-7786.MCR-22-0486

Figure 2.

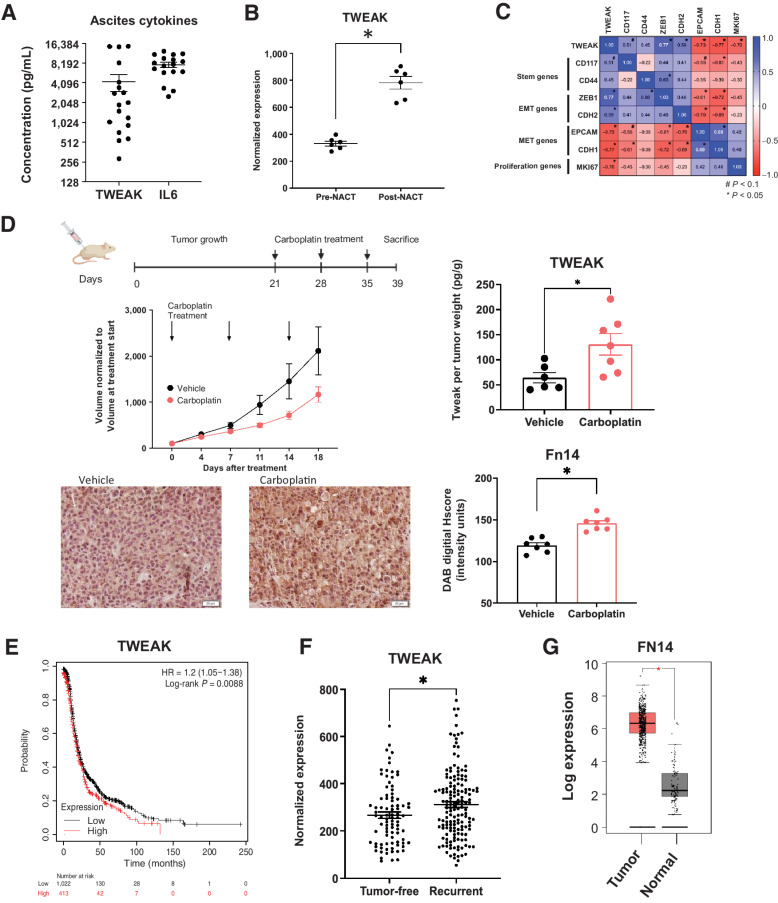
Figure 2. Following chemotherapy, TWEAK and its receptor, Fn14, are significantly elevated in patient samples and mouse tumors. A, TWEAK and IL6 concentration in noncellular ascites fraction collected from recurrent HGSOC patients (n = 18). B, TWEAK gene expression in ovarian cancer tumors collected pre- and post-neoadjuvant chemotherapy (NACT). Paired t test (n = 6). C, Pearson correlation of select genes to TWEAK expression for all collected samples (pre- and post-NACT; n = 6). D, Subcutaneous tumors were generated in nude mice using OV90 cells. Tumors were allowed to grow for 21 days followed by 3 cycles of carboplatin (50 mg/kg) or vehicle and resected 5 days after the final carboplatin treatment. Experimental design created with BioRender.com (top). Tumor volume was measured twice weekly and graphed normalized to the volume at treatment start (center, left). TWEAK concentration per tumor weight measured using ELISA (center, right). Unpaired t test (n = 6, 7). Fixed tumor fractions were histologically stained for Fn14. Representative images (bottom, left) and Fn14 digital H score quantification using ImageJ (bottom, right). Unpaired t test (n = 7, 7). E, Kaplan–Meier plots from KMPlotter comparing high expression (red) and low expression (black) of TWEAK and associated progression-free survival (PFS) of ovarian cancer patients (n = 1,435). F, TCGA analysis of TWEAK in tumors from HGSOC patients who recurred (tumor <5 years after follow-up) or remained tumor-free. Unpaired t test (n = 585). G, FN14 gene expression by Gepia2 of normal ovarian surface epithelium (black) and ovarian tumor (red). Unpaired t test (n = 88 normal, n = 426 tumor). Data represent mean and SEM. *, P < 0.05.

Following chemotherapy, TWEAK and its receptor, Fn14, are significantly elevated in patient samples and mouse tumors. A, TWEAK and IL6 concentration in noncellular ascites fraction collected from recurrent HGSOC patients (n = 18). B, TWEAK gene expression in ovarian cancer tumors collected pre- and post-neoadjuvant chemotherapy (NACT). Paired t test (n = 6). C, Pearson correlation of select genes to TWEAK expression for all collected samples (pre- and post-NACT; n = 6). D, Subcutaneous tumors were generated in nude mice using OV90 cells. Tumors were allowed to grow for 21 days followed by 3 cycles of carboplatin (50 mg/kg) or vehicle and resected 5 days after the final carboplatin treatment. Experimental design created with BioRender.com (top). Tumor volume was measured twice weekly and graphed normalized to the volume at treatment start (center, left). TWEAK concentration per tumor weight measured using ELISA (center, right). Unpaired t test (n = 6, 7). Fixed tumor fractions were histologically stained for Fn14. Representative images (bottom, left) and Fn14 digital H score quantification using ImageJ (bottom, right). Unpaired t test (n = 7, 7). E, Kaplan–Meier plots from KMPlotter comparing high expression (red) and low expression (black) of TWEAK and associated progression-free survival (PFS) of ovarian cancer patients (n = 1,435). F, TCGA analysis of TWEAK in tumors from HGSOC patients who recurred (tumor <5 years after follow-up) or remained tumor-free. Unpaired t test (n = 585). G, FN14 gene expression by Gepia2 of normal ovarian surface epithelium (black) and ovarian tumor (red). Unpaired t test (n = 88 normal, n = 426 tumor). Data represent mean and SEM. *, P < 0.05.