Figure 2.
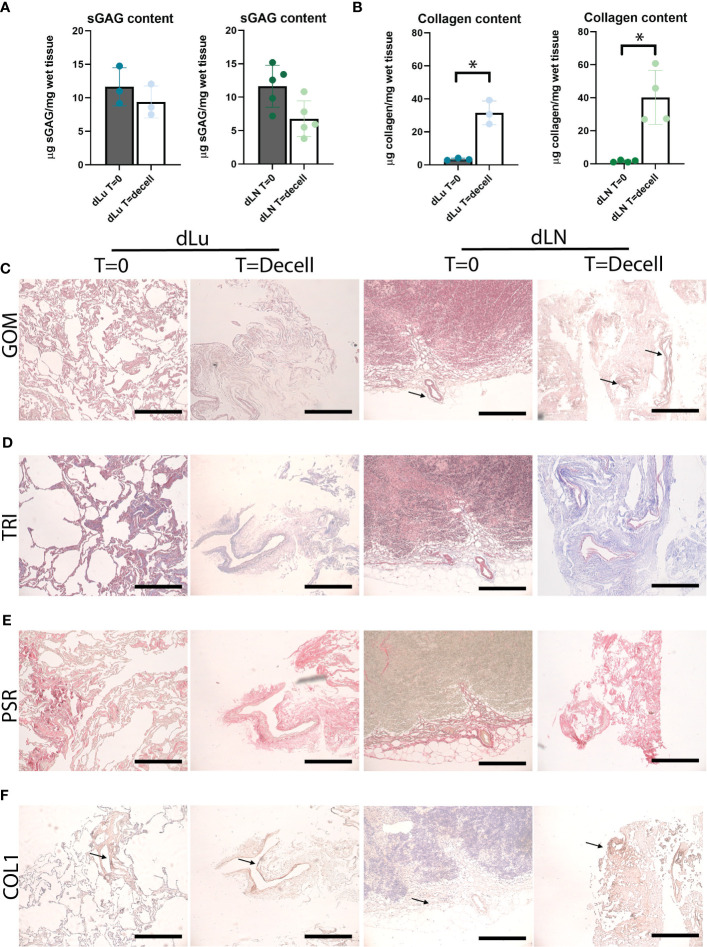
Preservation of ECM proteins after decellularization of human lung and lymph node. (A) Quantitative sGAG content analysis of lung (n=3, p=0.5) and lymph node (n=5, p=0.07) before and after decellularization showing retention of sGAG. dLu1, 2, 3 and dLN17, 27, 7, 10, 11 were used. (B) Quantitative collagen content analysis of lung (n=3, p=0.02) and lymph node (n=4, p=0.02) before and after decellularization, showing retention of collagen. dLu1, 2, 3 and dLN2, 4, 7, 15 were used. Paired t-tests were used for determining significance for determining significance in sGAG and collagen content. *= p-value <0.05. (C–E) Lung (dLu1) and lymph node (dLN12) before (T=0) and after (T=decell) decellularization stained with Gomori’s (GOM, C), Masson’s Trichrome (TRI, D) and PicroSirius Red (PSR, E) shows ECM architecture primarily consisting of collagen fibers. GOM shows reticulin (black), nuclei (red), and cytoplasm (pink). TRI shows muscle (red), collagen (blue), nuclei (brown/black), cytoplasm (brick red). (F) Representative images of collagen type 1 staining of lung (dLu1) and lymph node (dLN1) before and after decellularization. All scale bars indicate 200 µm.

