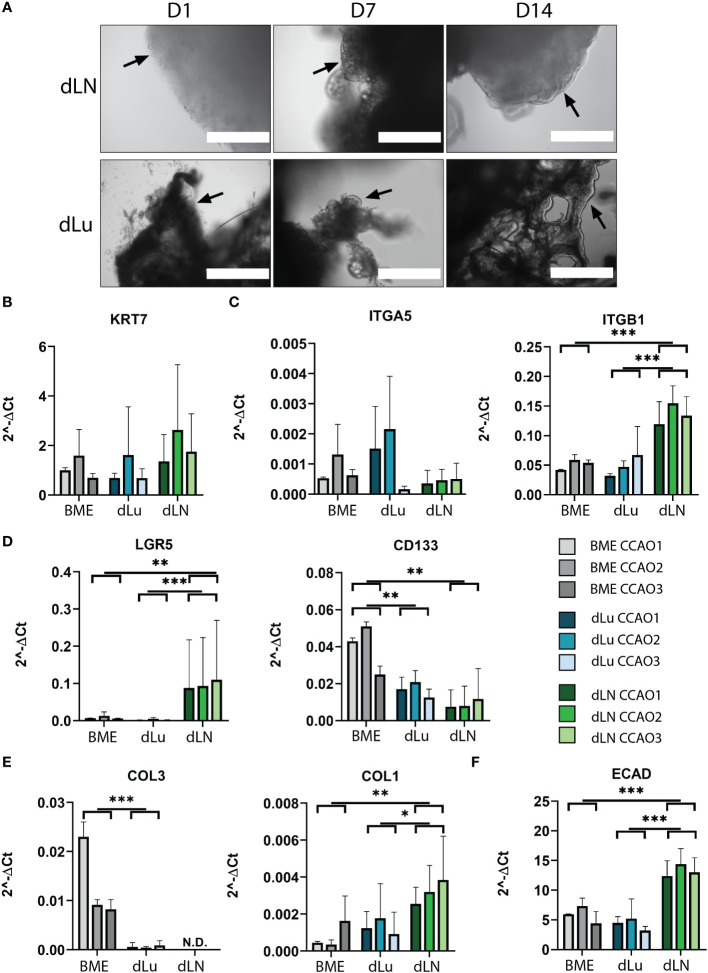
Figure 5.
Recellularization of dLu and dLN with CCAOs reveals distinct gene expression profiles. (A) Representative bright field microscopy images of CCAOs cultured in dLu and dLN on day 1, 7 and 14 after recellularization. Day 1 scale bar indicates 1000 µm, day 7 and day 14 scale bars indicate 400 µm. Black arrows indicate the progression from single cells at day 1 to a complete cellular layer at day 14. (B) Gene expression of KRT7 in CCAOs for BME control and recellularized dLu and dLN. (C) Gene expression of ITGA5 and ITGB1 in CCAOs for BME control and recellularized dLu and dLN. (D) Gene expression of LGR5 and CD133 in CCAOs for BME control and recellularized dLu and dLN. (E) Gene expression of COL3A1 and COL1A1 in CCAOs for BME control and recellularized dLu and dLN. (F) Gene expression of ECAD in CCAOs for BME control and recellularized dLu and dLN. * = p-value < 0.05, ** = p-value < 0.005, *** = p-value < 0.0001. N.D. means that the values were not detectable. Mann-Whitney U statistical test was used for determining significance in gene expression profiles. All gene expression profiles were normalized to GAPDH. For recellularization experiments dLu1, dLu2, dLu3 were used for lung and dLN9, dLN8, and dLN1 were used for lymph node.

