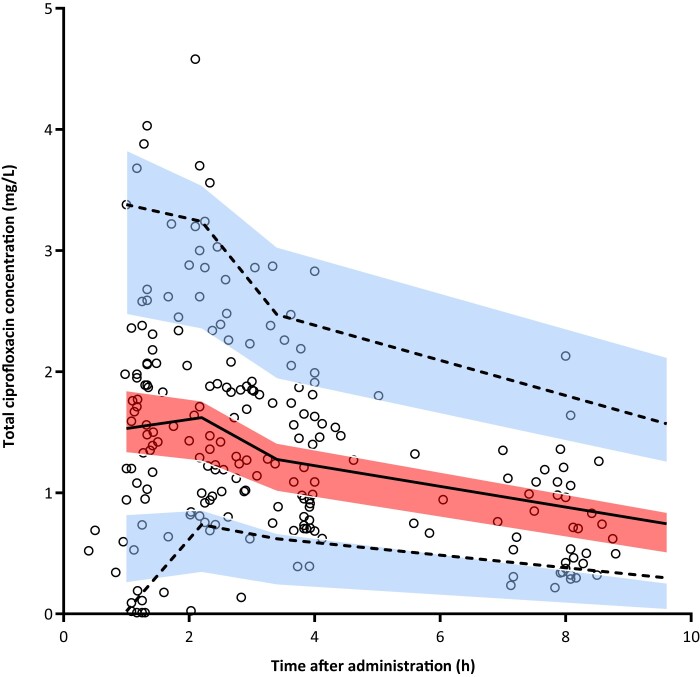
Figure 2.
VPC for the total ciprofloxacin concentrations versus time based on 1000 simulations of the final model. The black open circles are the observed concentrations. The solid line represents the median and the dashed lines the 5th and 95th percentiles of the observed data. The centre, red shaded area is the 95% CI of the model-predicted median and the outer, blue shaded areas are the 95% CIs of the model-predicted 5th and 95th percentiles. In the 5th percentile (lower blue shaded area) there is a minor overestimation of observed concentrations with time after administration <2 h and a minor underestimation at the end of the dosing interval. The overestimation was likely to be caused by three observed concentrations that were <LLQ and which were imputed with a value of LLQ/2, which the final model cannot predict. Overall, these model misspecifications are small and all other solid and dashed lines run within their respective shaded areas, demonstrating sufficient fit of the model. This figure appears in colour in the online version of JAC and in black and white in the print version of JAC.

