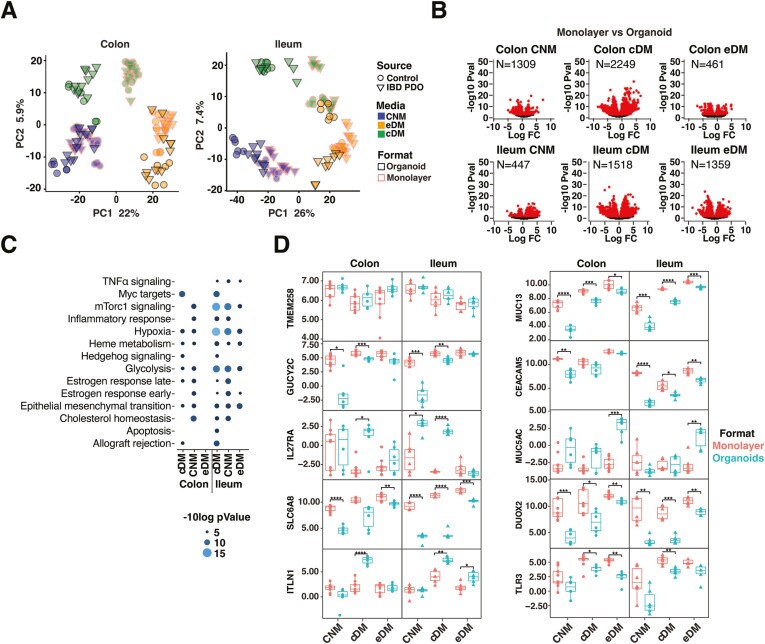
Figure 3.
Intestinal cells respond differently to plating in organoid vs monolayer formats. A, PCA analysis of organoid and monolayer formats. B, Genes differentially expressed between monolayers and organoids. Red symbols are significantly different between conditions (FDR < .01). C, Differentially expressed pathways between monolayers and organoids. D, Normalized expression of selected epithelial genes. Box plots denote the average and standard deviation of 3 technical replicates of 2 to 3 independent biological replicates per condition. Relevant statistics were performed using ttest with Bonferroni multiple comparison correction (*P < .05, **P < .01, ***P < .001, ****P < .0001).

