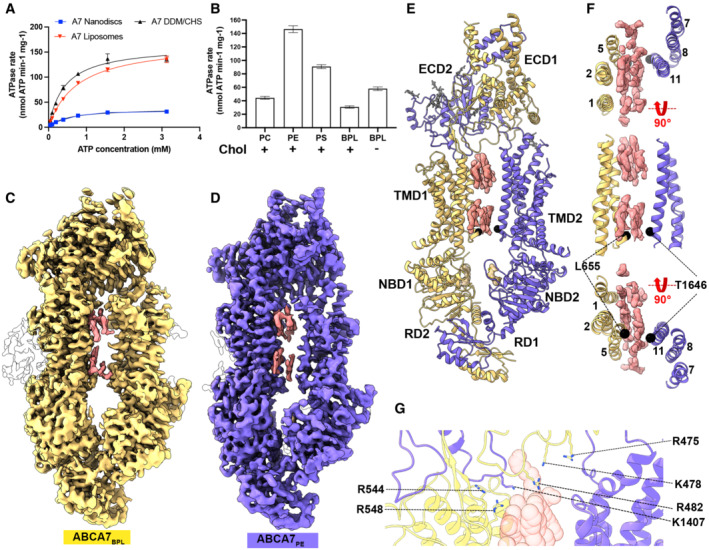
Figure 1. Functional characterization and structure of human ABCA7 incorporated in nanodiscs.

-
A, B(A) ATPase activity of ABCA7 at different ATP concentrations and (B) different nanodisc phospholipid/cholesterol compositions. Cholesterol (20%) presence is indicated by + or −. Experimental replicates (n) = 3 and error bars represent standard deviation (s.d.).
-
C, D(C) Cryo‐EM map of ABCA7BPL (yellow) at 3.6 Å resolution and (D) ABCA7PE at 4.0 Å resolution (purple). Density for protein is shown in yellow (0.025 contour) and that for modeled lipid acyl chains (0.035 contour) shown in pink (TMD luminal lipids) and white (peripherally associated lipids).
-
EABCA7PE shown in ribbon format with half 1 colored yellow and half 2 purple, along with density for TMD lipids (pink 0.025 contour) and bound nucleotide (yellow 0.035 contour). Acyl chains and glycans are shown as pink and gray sticks, respectively.
-
FTMD lumen with density for TMD lipids (pink 0.025 contour) viewed from the extracellular side (top), membrane plane (middle) and cytoplasmic side (bottom). Cα atoms for the cytoplasmic gate are shown as black spheres.
-
GView of the TMD‐ECD interface with select residues oriented toward lipids (transparent red spheres) shown.
