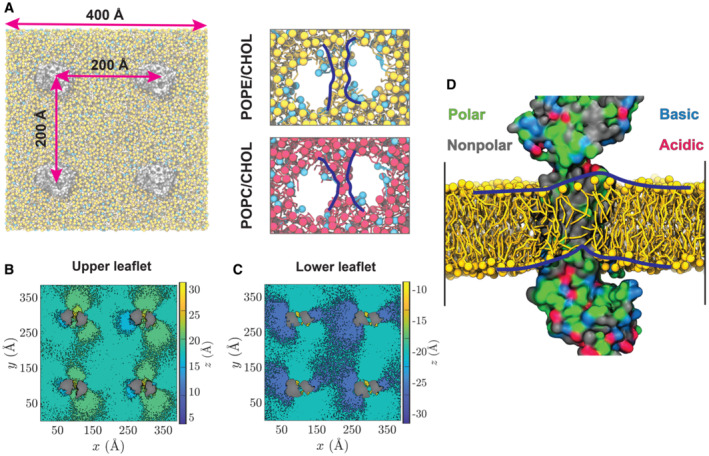
Figure 5. MD Simulations of ABCA7 in Lipid Bilayers.

-
ALeft: A representative simulation system with four copies of ABCA7 (silver), taken from the POPE/cholesterol (yellow/cyan) lipid patch. Right: the phospholipid belt (blue lines) formed in (top) the POPE/cholesterol (yellow/cyan) and (bottom) POPC/cholesterol (red/cyan) membranes (t = 2 μs).
-
B, CHeatmaps representing the average height (z values) of POPC headgroups with respect to the membrane midplane in the extracellular/upper (B) and cytoplasmic/lower (C) leaflets. Phospholipids are observed to climb the protein and form an elevated configuration within the TMD lumen.
-
DSnapshot of lipids partitioned in the TMD lumen at t = 2 μs. Polar, nonpolar, basic, and acidic residues are colored green, gray, blue, and red, respectively. TMD2 is hidden for a clearer view of the luminal dome‐like lipid configuration (outlined by blue lines).
