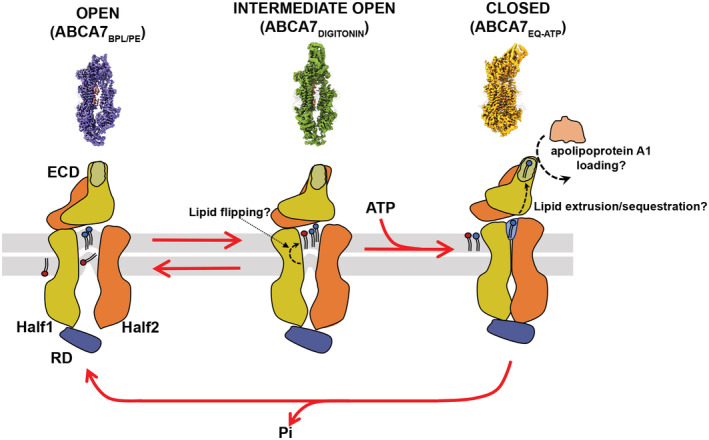
Figure 6. Proposed model of ABCA7 conformational transitions and lipid interactions.

The proposed model displays the fully open conformation (left) with ordered lipids (red and blue) in the TMD, the intermediate open (middle) with the upward protrusion of the upper and lower leaflets with black dash arrows indicating movement of lipids under the influence of TMD conformation, and the closed conformation (right) exhibiting the lipid exit pocket for extrusion to the ECD where they may be sequestered and reside until an acceptor molecule is available. Question marks denote speculated mechanisms. The membrane bilayer leaflets are shown in gray. The surface maps on the upper panel represent three different states of ABCA7 the mechanistic model is derived from. Differences in ECD appearance are meant to show different orientations and not large‐scale structural transitions.
