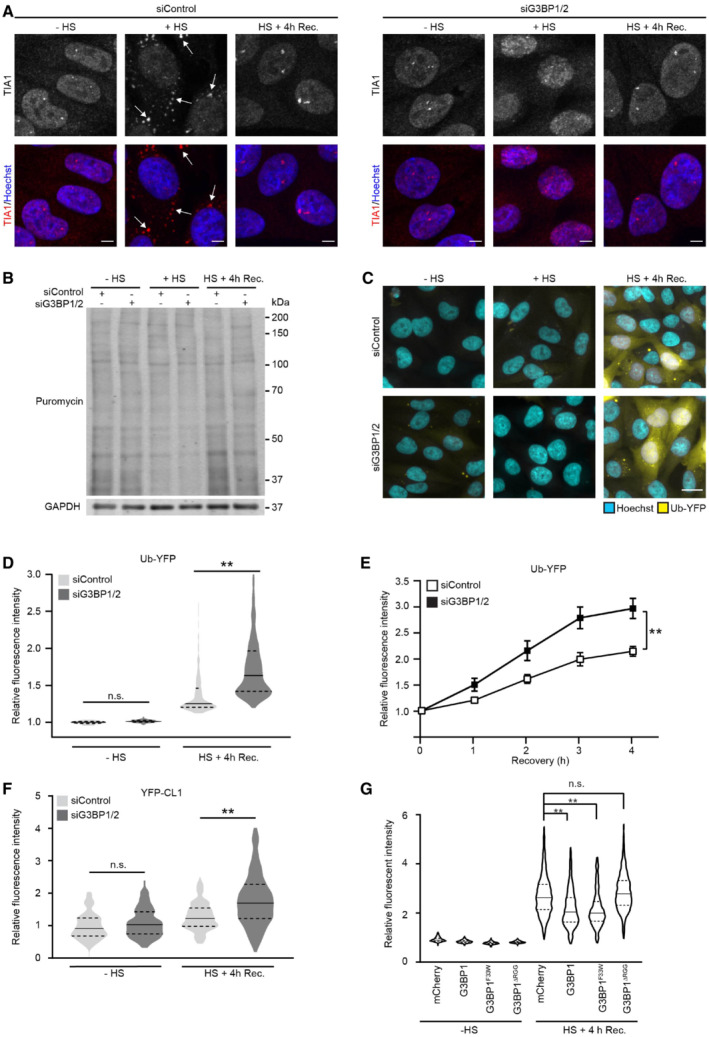
Representative confocal images of immunofluorescent staining of the stress granule marker TIA1 in control (siControl, left panel) and G3BP1/2‐depleted (siGRBP1/2, right panel) MelJuSo cells. Cells were left untreated (− HS), exposed to 43°C for 30 min (+ HS), and followed for 4 h after heat shock (HS + 4 h Rec.). Arrows indicate the stress granules in thermally stressed control cells. Scale bar, 10 μm.
Analysis of puromycin incorporation in MelJuSo cells that were left untreated (− HS), exposed to 43°C for 30 min (+ HS), and followed for 4 h after heat shock (HS + 4 h Rec.). The blots were probed with antibodies against puromycin, and GAPDH as a loading control.
Representative images of MelJuSo cells expressing Ub‐YFP, which were either left untreated (− HS), or exposed to 43°C for 30 min (+ HS) and followed for 4 h after heat shock (HS + 4 h Rec.). Scale bar, 20 μm.
Quantification of mean cellular YFP fluorescence intensities from the experiment shown in (C), normalized to untreated control cells (siControl ‐ HS). The frequency and distribution of the relative fluorescence intensities per cell are shown as violin plots. The solid lines in each distribution represent the median, and dash lines represent the upper and lower interquartile range limits (n = 3 independent experiments, > 1,000 cells analyzed per condition, Kruskal‐Wallis test, **P < 0.01, n.s.—not significant).
Kinetics of Ub‐YFP image intensities in control (siControl) and stress granule‐deficient MelJuSo cells (siG3BP1/2) in response to a 30 min 43°C heat shock, followed by 4 h at 37°C (Recovery). Error bars indicate the standard error of the mean (n = 3 independent experiments, 12 images analyzed per condition, Student's unpaired t‐test, **P < 0.01).
Quantification of MelJuSo cells expressing YFP‐CL1. Normalized to untreated control cells (siControl ‐ HS). The frequency and distribution of the relative fluorescent intensity per cell are shown as violin plots. The solid lines in each distribution represent the median, and dash lines represent the upper and lower interquartile range limits (n = 3 independent experiments, > 1,000 cells analyzed per condition, Kruskal‐Wallis test, **P < 0.01, n.s.—not significant).
Quantification of MelJuSo Ub‐YFP cells transfected with G3BP1/2 siRNA AND siRNA‐resistant G3BP1 mutants YFP intensities. Normalized to mCherry untreated control cells (− HS). The frequency and distribution of the relative fluorescent intensity per cell are shown as violin plots. The solid lines in each distribution represent the median, and dash lines represent the upper and lower interquartile range limits (n = 3 independent experiments, > 1,000 cells analyzed per condition, Kruskal‐Wallis test, **P < 0.01, n.s.—not significant).

