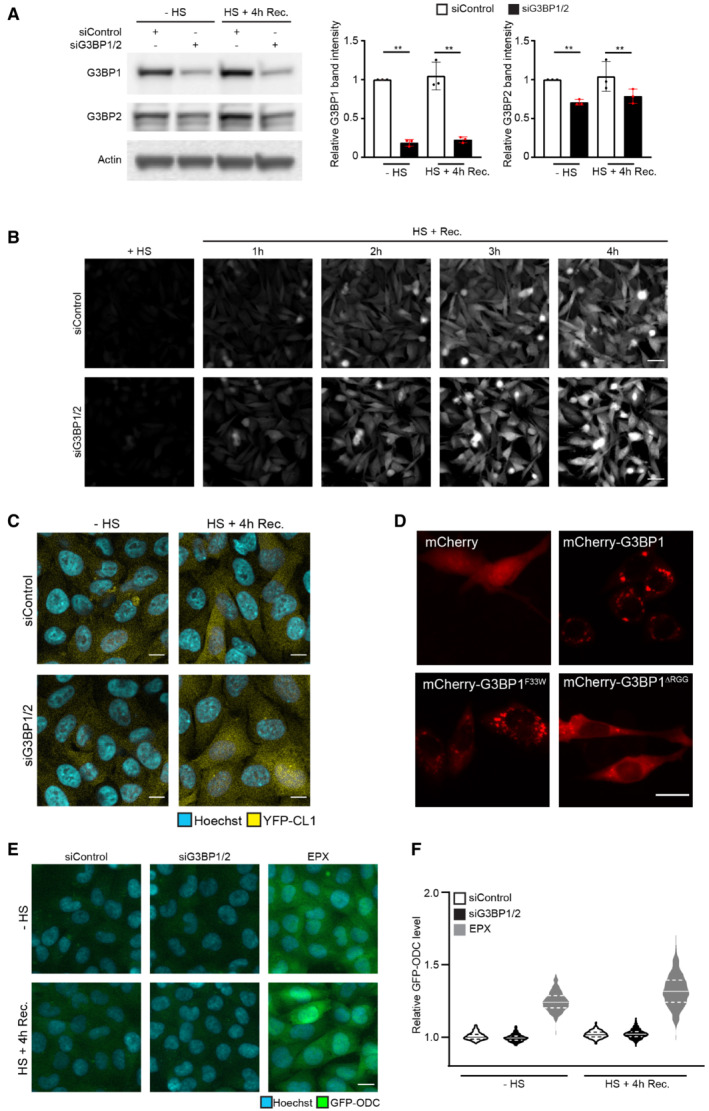
MelJuSo cells expressing Ub‐YFP transfected with control siRNA or G3BP1 and G3BP2 siRNA were either left untreated (− heat shock) or exposed to 43°C for 30 min and followed for 4 h after the heat shock (Recovery). Cell lysates were analyzed by immunoblot with G3BP1, G3BP2, and GAPDH antibodies. Quantification of the G3BP1 and G3BP2 band densities. Data represent the mean ± SD (n = 3 independent experiments, Student's unpaired t‐test, **P < 0.01).
MelJuSo cells expressing Ub‐YFP transfected with control siRNA or G3BP1 and G3BP2 siRNA were subjected to 43°C heat shock for 30 min and followed by automated high‐content imaging every 10 min for 4 h. Representative images are shown. Scale bar is 20 μm.
Fluorescence micrographs of MelJuSo cells expressing YFP‐CL1, which were either left untreated (− heat shock) or exposed to 43°C for 30 min and followed for 4 h after the heat shock (HS+ 4 h Rec.). Scale bar is 10 μm.
Representative images of MelJuSo expressing Ub‐YFP, which were transfected with G3BP1/2 siRNA and either transfected with mCherry‐C1, mCherry‐G3BP1, mCherry‐G3BP1F33W or mCherry‐G3BP1∆RGG plasmids and subjected to heat shock. Scale bar is 20 μm.
Fluorescence micrographs of MelJuSo cells expressing GFP‐ODC, which were either left untreated (− heat shock) or exposed to 43°C for 30 min and followed for 4 h after heat shock (HS+ 4 h Rec.). Scale bar is 20 μm.
Quantification of (E) of > 500 cells per group. Normalized to siControl “‐ heat shock.” The frequency and distribution of the relative fluorescent intensity per cell are shown as violin plots. The solid lines in each distribution represent the median, and dash lines represent the upper and lower interquartile range limits (n = 3 independent experiments, > 1,000 cells analyzed per condition).

