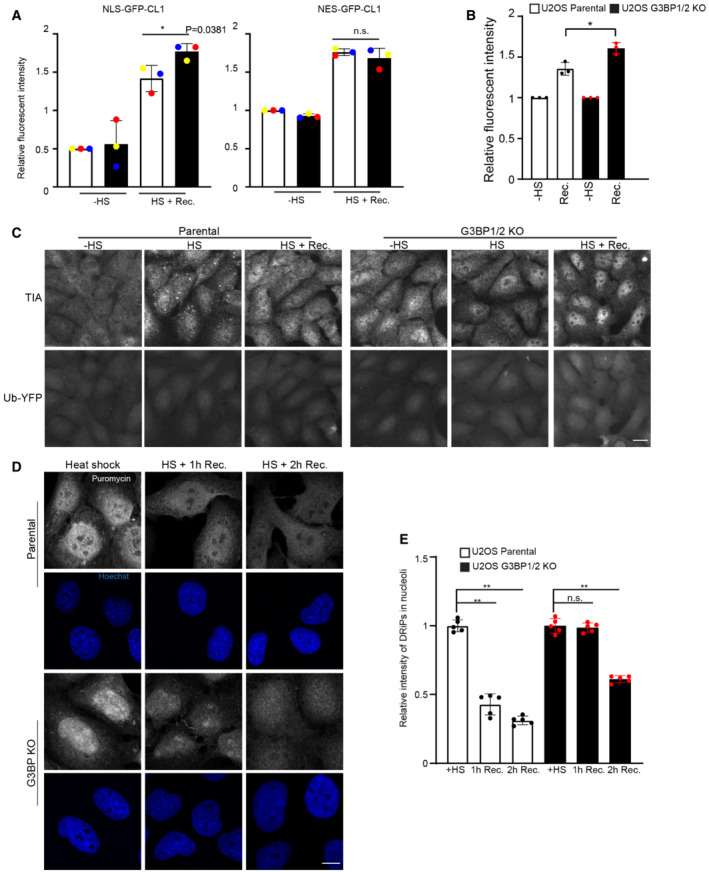
Flow cytometric detection of fluorescent intensities MelJuSo cells expressing NLS/NES‐GFP‐CL1, which were either left untreated (− HS), or exposed to 43°C for 30 min and followed for 4 h after heat shock (HS+ Rec.). Data represent the mean ± SD (n = 3 independent experiments, Student's unpaired t‐test, *P < 0.05).
Flow cytometric detection of fluorescent intensities in parental U2OS and G3BP1/2 knockout (KO) cells expressing Ub‐YFP, which were either left untreated (− HS), or exposed to 43°C for 30 min and followed for 4 h after heat shock (Rec.). Data represent the mean ± SD (n = 3 independent experiments, Student's unpaired t‐test, *P < 0.05).
Fluorescence micrographs of parental U2OS and G3BP1/2 KO cells expressing Ub‐YFP, which were either left untreated (− HS), exposed to 43°C for 30 min (HS), or followed for 4 h after heat shock (HS+ Recovery). Stress granules are visualized by immunostaining for TIA1. Scale bar is 10 μm.
Representative confocal images of immunofluorescent staining of puromycin‐labeled proteins in parental and G3BP1/2 KO U2OS cells exposed to a heat shock (+ HS; left panel), after 1 h recovery (HS + 1 h Rec.; middle panel), and after 2 h recovery (HS + 2 h Rec.; right panel). Scale bar is 10 μm.
Quantification of nucleolar localization of puromycin labeled proteins in parental and G3BP1/2 KO U2OS cells in (D). Data represent the mean ± SD (n = 3 independent experiments, > 50 cells analyzed per condition, Kruskal‐Wallis test, **P < 0.01, n.s.—not significant).

