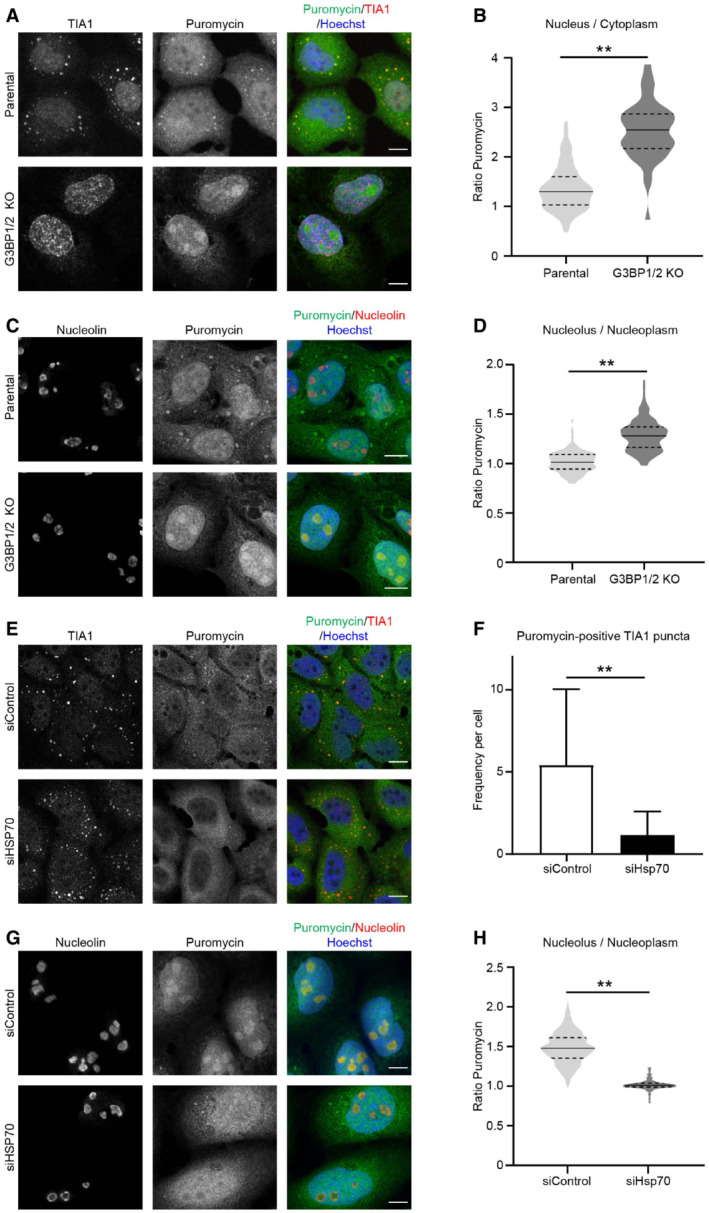
Representative confocal images of immunofluorescent staining of the stress granule marker TIA1 and puromycin‐labeled proteins in parental and G3BP1/2 knockout U2OS cells. Cells were subjected to 43°C heat shock. Scale bar, 10 μm.
Quantification of the nucleus/cytoplasm ratios of puromycin intensities in images from (A). The frequency and distribution of the ratio per cell are shown as violin plots. The solid lines in each distribution represent the median, and dash lines represent the upper and lower interquartile range limits (n = 3 independent experiments, > 50 cells analyzed per condition, Kruskal‐Wallis test, **P < 0.01).
Representative confocal images of immunofluorescent staining of the nucleolar marker nucleolin and puromycin‐labeled proteins in parental and G3BP1/2 knockout U2OS cells. Cells were subjected to 43°C heat shock. Scale bar, 10 μm.
Quantification of the nucleolus/nucleoplasm ratio of puromycin intensities in images from (B). The frequency and distribution of the ratio per cell are shown as violin plots. The solid lines in each distribution represent the median, and dash lines represent the upper and lower interquartile range limits (n = 3 independent experiments, > 50 cells analyzed per condition, Kruskal‐Wallis test, **P < 0.01).
Representative confocal images of immunofluorescent staining of the stress granule marker TIA1 and puromycin‐labeled proteins in control (siControl) and Hsp70‐depleted (siHsp70) U2OS cells. Cells were subjected to 43°C heat shock Scale bar, 10 μm.
Quantification of the numbers of puromycin‐positive TIA dots per cell in images from (E). The numbers of positive foci per cell are shown as violin plots. The solid lines in each distribution represent the median, and dash lines represent the upper and lower interquartile range limits (n = 3 independent experiments, > 50 cells analyzed per condition, Kruskal‐Wallis test, **P < 0.01).
Representative confocal images of immunofluorescent staining of the nucleolar marker nucleolin and puromycin‐labeled proteins in control (siControl) and Hsp70‐depleted (siHsp70) G3BP1/2 knockout U2OS cells. Cells were subjected to 43°C heat shock. Scale bar, 10 μm.
Quantification of the nucleolus/nucleoplasm ratio of puromycin intensities in images from (G). The frequency and distribution of the ratio per cell are shown as violin plots. The solid lines in each distribution represent the median, and dash lines represent the upper and lower interquartile range limits (n = 3 independent experiments, > 50 cells analyzed per condition, Mann–Whitney test, **P < 0.01).

