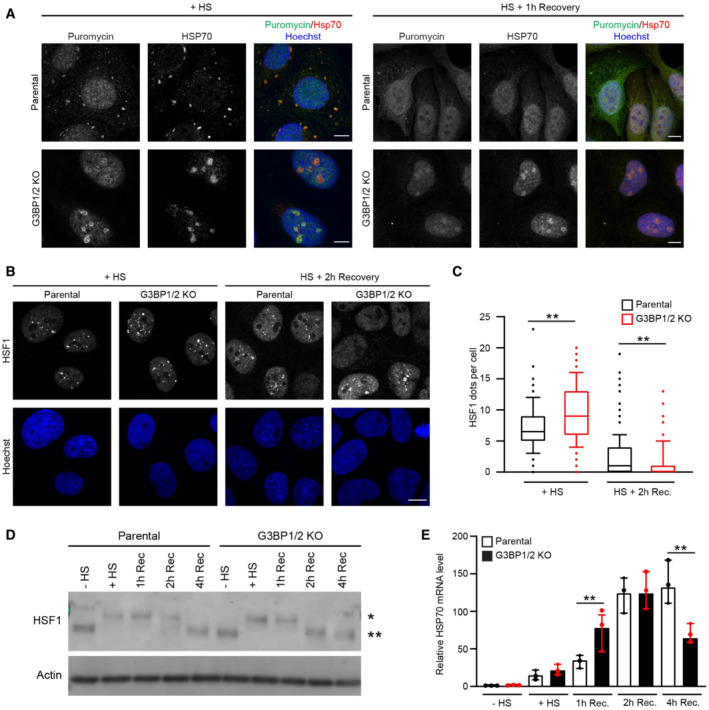
Representative confocal images of immunofluorescent staining of and puromycin‐labeled proteins and Hsp70 in parental and G3BP1/2 knockout U2OS cells exposed to a heat shock at 43°C for 30 min (+ HS; left panel), and after 1 h recovery (HS + 1 h Recovery; right panel). Scale bar, 10 μm.
Representative confocal images of immunofluorescent staining of HSF1 in parental and G3BP1/2 knockout U2OS cells directly after heat shock (+ HS) and 2 h after 2 h recovery (HS + 2 h Recovery). Scale bar, 10 μm.
Quantification of the number of HSF1 foci per cell in images from (B), shown as a box plot with median and 5–95 percentiles (n = 3 independent experiments, > 300 cells analyzed per condition, Kruskal‐Wallis test, **P < 0.01).
Western blot analysis of parental and G3BP1/2 knockout U2OS cells that were left untreated (− HS), heat‐shocked (HS), and followed for 1, 2, and 4 h after heat shock (Rec). The blots were probed with antibodies against HSF1 and GAPDH (* indicated phosphorylated HSF1, and ** indicates unphosphorylated HSF1).
Analysis of HSP70 mRNA levels in parental and G3BP1/2 knockout U2OS cells that were left untreated (− HS), heat‐shocked (+ HS), and followed for 1, 2, and 4 h after heat shock (Rec.). mRNA levels were normalized to untreated samples. Data represent the geometric mean with 95% confidence interval of triplicate samples (Student's unpaired t‐test, **P < 0.01).

