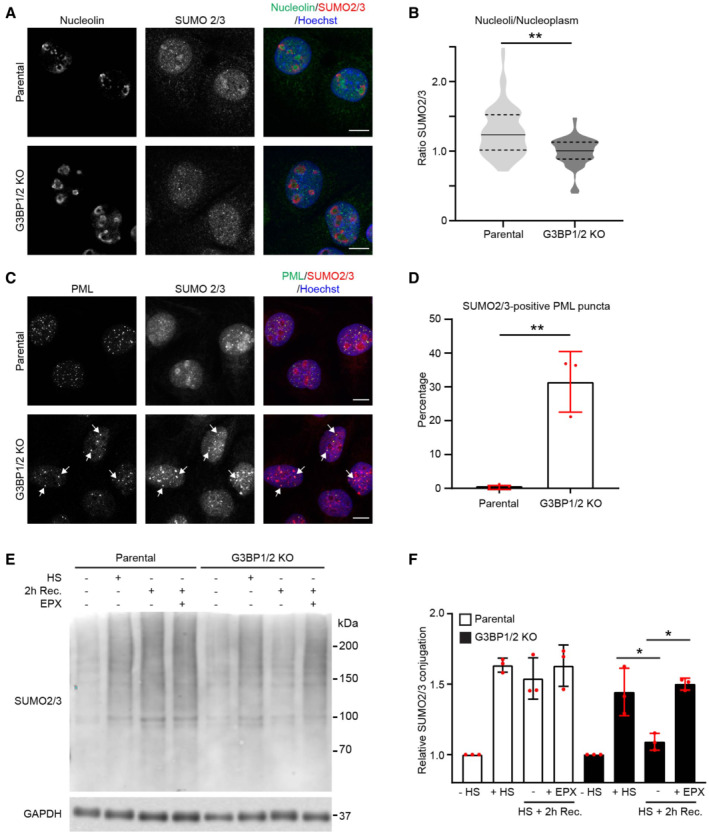
Representative confocal images of immunofluorescent staining of the nucleolar marker nucleolin and SUMO2/3 in parental and G3BP1/2 knockout U2OS cells. Cells were subjected to a heat shock (30 min, 43°C) followed by 2 h recovery. Scale bar, 10 μm.
Quantification of the nucleolus/nucleoplasm ratio of SUMO2/3 intensities in images from (A). The frequency and distribution of the ratio per cell are shown as violin plots. The solid lines in each distribution represent the median, and dash lines represent the upper and lower interquartile range limits (n = 3 independent experiments, > 50 cells analyzed per condition, Mann–Whitney test, **P < 0.01).
Representative confocal images of immunofluorescent staining of PML bodies (PML) and SUMO2/3 in parental and G3BP1/2 knockout U2OS cells. Cells were heat‐shocked followed by 2 h recovery. Arrows indicate dots positive for PML and SUMO2/3 staining. Scale bar, 10 μm.
Quantification of SUMO2/3 positive PML puncta in images from (C). Data represent the mean ± SD (n = 3 independent experiments, > 50 cells analyzed per condition, Mann–Whitney test, **P < 0.01).
Analysis of SUMO2/3 conjugates in parental and G3BP1/2 knockout U2OS cells that were left untreated (− HS), exposed to a heat shock (+ HS), and followed for 2 h (2 h Rec.) with or without 100 nM proteasome inhibitor epoxomicin (EPX).
Quantification of the total SUMO2/3 conjugate band densities in (E). Data represent the mean ± SD (n = 3 independent experiments, Student's unpaired t‐test, *P < 0.05).

