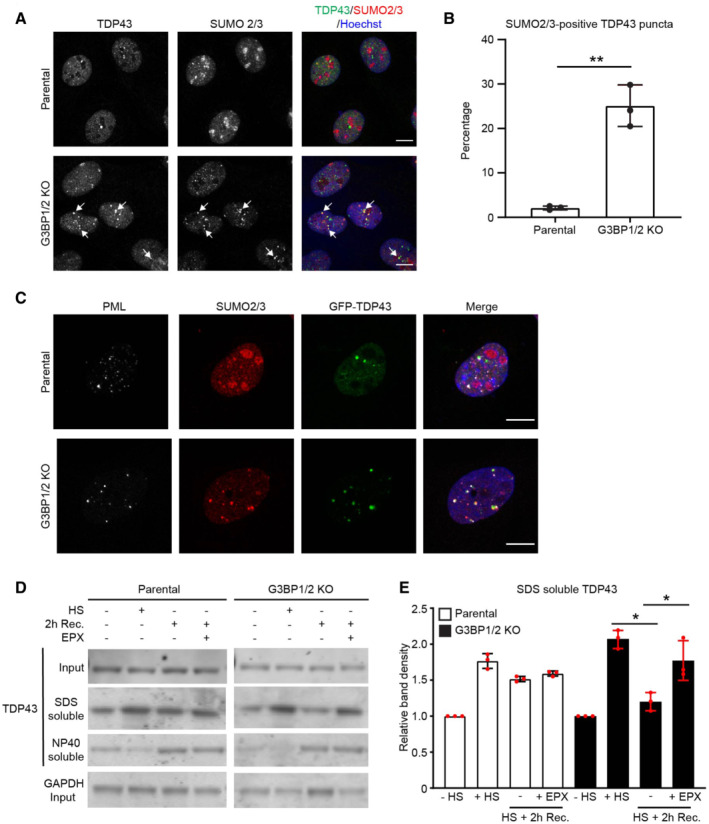
Representative confocal images of immunofluorescent staining of SUMO2/3 and TDP43 in parental and G3BP1/2 knockout U2OS cells. Cells were exposed to a heat shock (30 min, 43°C) followed by 2 h recovery. Arrows indicate dots positive for TDP‐43 and SUMO2/3 staining. Scale bar, 10 μm.
Quantification of the percentage of SUMO2/3 positive TDP43 puncta in images from the experiment shown in (A). Data represent the mean ± SD (n = 3 independent experiments, > 50 cells analyzed per condition, Mann–Whitney test, **P < 0.01).
Representative confocal images of immunofluorescent staining of SUMO2/3 and PML bodies (PML) in parental and G3BP1/2 knockout U2OS cells transiently transfected with GFP‐TDP43. Cells were subjected to heat shock and followed by 2 h recovery. Scale bar, 10 μm.
Analysis of detergent SDS and NP40 soluble fractions of TDP43 in parental and G3BP1/2 knockout U2OS cells that were left untreated (−HS), exposed to a heat shock (+HS) followed by 2 h recovery (2 h Rec.) in absence or presence of 100 nM proteasome inhibitor epoxomicin (EPX).
Quantification of the TDP43 band densities in the SDS‐soluble fraction. Data represent the mean ± SD (n = 3 independent experiments, Student's unpaired t‐test, *P < 0.05).

