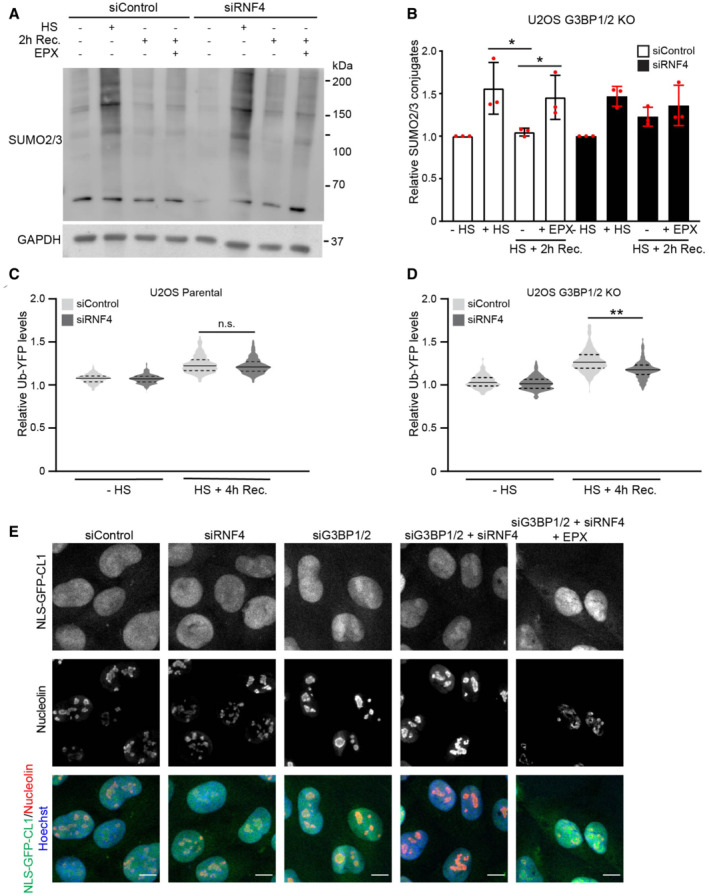
Analysis of SUMO2/3 conjugates in control (siControl) or RNF4‐depleted (siRNF4) G3BP1/2 knockout U2OS cells. Cells were left untreated (−HS), exposed to a heat shock (+HS), followed by 2 h recovery (HS + 2 h Rec.) in the absence or presence of 100 nM proteasome inhibitor epoxomicin (EPX).
Quantification of the total SUMO2/3 band densities. Data represent the mean ± SD (n = 3 independent experiments, *P < 0.05).
Quantification of mean cellular Ub‐YFP fluorescence intensities in control (siControl) and RNF4‐depleted (siRNF4) parental U2OS cells. Cells were left untreated (−HS) or exposed to a heat shock followed by 4 h recovery (HS + 4 h Rec.). Fluorescence intensities are normalized to untreated control cells (siControl ‐ HS). Frequency and distribution of the relative fluorescence intensities are shown as violin plots. The solid lines in each distribution represent the median, and dash lines represent the upper and lower interquartile range limits (n = 3 independent experiments, > 1,000 cells analyzed per condition, Kruskal‐Wallis test, n.s.—not significant).
Quantification of mean cellular Ub‐YFP fluorescence intensities in control (siControl) and RNF4‐depleted (siRNF4) G3BP1/2 knockout U2OS cells. Cells were left untreated (−HS) or exposed to a heat shock followed by 4 h recovery (HS + 4 h Rec.). Fluorescence intensities are normalized to untreated control cells (siControl ‐ HS). Frequency and distribution of the relative fluorescence intensities are shown as violin plots. The solid lines in each distribution represent the median, and dash lines represent the upper and lower interquartile range limits (n = 3 independent experiments, > 1,000 cells analyzed per condition, Kruskal‐Wallis test, **P < 0.01).
Representative confocal images of control (siControl), RNF4‐depleted (siRNF4), G3BP1/2‐depleted (siG3BP1/2) and G3BP1/2‐ and RNF4‐depleted (siG3BP1/2 + siRNF4) MelJuSo cells expressing the nuclear UPS reporter NLS‐GFP‐CL1. Cells were exposed to a heat shock followed by 4 h recovery in the absence or presence of the proteasome inhibitor epoxomicin (EPX). The nucleolar marker nucleolin was stained by immunofluorescence. Scale bar, 10 μm.

