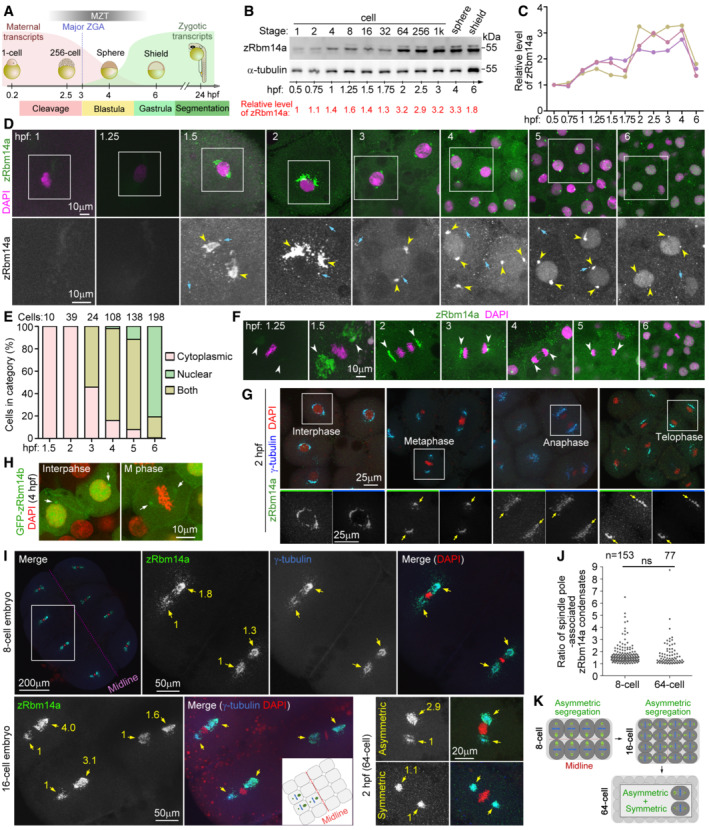
Figure 1. zRbm14a decorates cytoplasmic condensates implicated in cell fate regulations in early embryos.

-
AA schematic diagram of zebrafish early embryonic development (Aanes et al, 2014; Winata et al, 2018; Vastenhouw et al, 2019). The red and green curves illustrate levels of maternal and zygotic RNA transcripts, respectively. Hpf, hours post‐fertilization; MZT, maternal‐to‐zygotic transition; ZGA, zygotic gene activation. The diagrams are not drawn to scale.
-
B, CExpression profile of zRbm14a during early embryonic development. Lysates from 5 embryos were loaded in each lane and subjected to immunoblotting (B). α‐tubulin served as an internal control. The relative levels of zRbm14a (B, C) are shown as band intensities normalized to those of α‐tubulin. Quantification results from three independent experiments are shown in (C).
-
D, ESubcellular localizations of zRbm14a. The representative confocal micrographs (D) were acquired from the animal pole of zebrafish embryos. Exposures were kept the same during the imaging for comparison. DAPI labels nuclear DNA. Framed regions were magnified to show details. Arrows denote representative cytoplasmic puncta, whereas arrowheads point to perinuclear condensates. Subcellular localizations (E) were scored from the indicated number of cells from 4 to 6 embryos.
-
FSpindle‐pole enrichment of zRbm14a condensates (arrowheads) in mitotic cells. Exposures were kept the same during the imaging for comparison.
-
GzRbm14a condensates colocalized with γ‐tubulin puncta. The framed blastomeres at the indicated cell cycle stages were magnified to show details. Arrows point to spindle poles.
-
HSubcellular localizations of zRbm14b resembled those of zRbm14a. Zebrafish embryos were microinjected with 400 pg of GFP‐Rbm14b mRNA per egg at the 1‐cell stage and fixed at 4 hpf.
-
IAsymmetric segregations of zRbm14a condensates in mitotic blastomeres by associating with centrosomal γ‐tubulin puncta (arrows). A typical 8‐cell mitotic embryo was entirely represented, with the two blastomeres in the framed region magnified to show details. The cartoon inset illustrates relative positions of the three blastomeres in the 16‐cell embryo. Numbers in yellow are relative fluorescent intensities of spindle pole‐associated zRbm14a condensates, with the smaller ones set to 1. Refer to Movies EV1 and EV2 for 3D‐reconstructed images of the two representative cells in 2‐hpf embryos.
-
JQuantification results on the ratio of zRbm14a condensates associated with spindle pole pairs in mitotic blastomere.
-
KSummarizing illustrations showing segregation patterns of zRbm14 condensates (green) in mitotic blastomeres. Condensates in 8‐ and 16‐cell embryos are segregated mainly in an asymmetric pattern identical to that of centrosomes (Rathbun et al, 2020), that is, larger centrosome contains more zRbm14 condensates than the smaller centrosome does in a cell and is located closer to the embryonic midline. In 64‐cell embryos, blastomeres display both asymmetric and symmetric segregations of the condensates, though the distribution pattern of these cells is currently unclear. The diagrams are not drawn to scale.
Data information: Micrographs were maximum intensity‐projected images. Quantification results in (J), from 20 mitotic 8‐cell embryos and 29 2‐hpf embryos, are presented as mean ± SD plus sample dots. Unpaired two‐sided Student's t‐test: ns, no significance.
Source data are available online for this figure.
