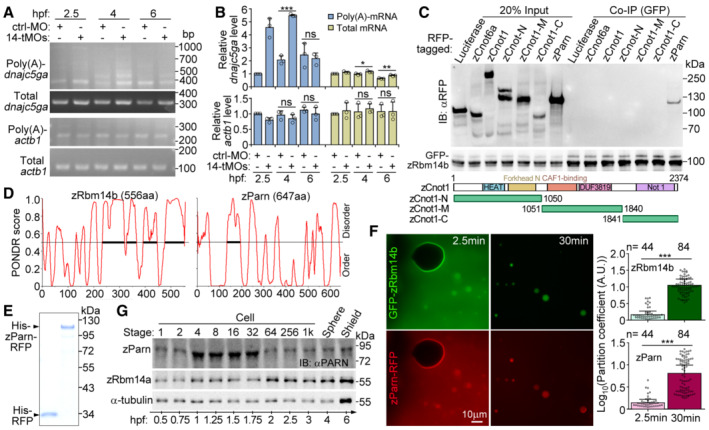
Figure EV4. Relationships between zRbm14 and zParn (related to Fig 7).

-
A, BDepletion of zRbm14 resulted in an accumulation of poly(A)‐containing maternal transcripts of dnajc5ga. Total RNAs purified from the indicated zebrafish embryos were subjected to poly(A) length assays as illustrated in Fig 7A. Transcripts of actb1 (β‐actin mRNA), which was not a target of zRbm14 based on Fig 6D and E, served as a negative control. One set of representative PCR results (A) and quantification results from three independent experiments (B) are presented. The major band of poly(A)‐actb1 was quantified, as in Fig 7B. As poly(A)‐dnajc5ga emerged as multiple bands, their total intensity was measured.
-
CzParn, but not components of the CCR4‐NOT complex, associated with zRbm14b. GFP‐zRbm14b was co‐expressed with the indicated RFP‐fusion proteins in HEK293T cells. Co‐immunoprecipitations (co‐IP) were performed with anti‐GFP beads. Luciferase served as a negative control. zCnot6a, zebrafish CCR4a orthologue; zCnot1, zebrafish Not1 orthologue. Diagrams of zCnot1 mutants are provided.
-
DSecondary structure prediction for zRbm14b and zParn using Predictor of Natural Disordered Regions (PONDR). Bold line indicates predicted IDR.
-
EPurified RFP and zParn‐RFP from E. coli. The proteins were subjected to SDS–PAGE, followed by Coomassie blue staining.
-
FEfficient co‐phase separation of 10‐μM zParn and 10‐μM zRbm14b. Purified zParn‐RFP was mixed with GFP‐zRbm14b and imaged under a wide‐field microscope at 2.5 and 30 min, respectively. Partition coefficients were respectively calculated for 44 or 84 droplets from three independent experiments and pooled together in the histograms.
-
GExpression profile of zParn during early embryogenesis. Lysates from 5 embryos were loaded in each lane. Immunoblotting was performed with an anti‐human PARN antibody. α‐tubulin and zRbm14a served as internal controls.
Data information: Quantification results are presented as mean ± SD, with sample dots. Unpaired two‐sided Student's t‐test: ns, no significance; *P < 0.05; **P < 0.01; ***P < 0.001. Note that the t‐test cannot be performed for the 2.5‐hpf samples in (B) because the relative mRNA levels of the control samples were set as 1 and thus have no error bars.
Source data are available online for this figure.
