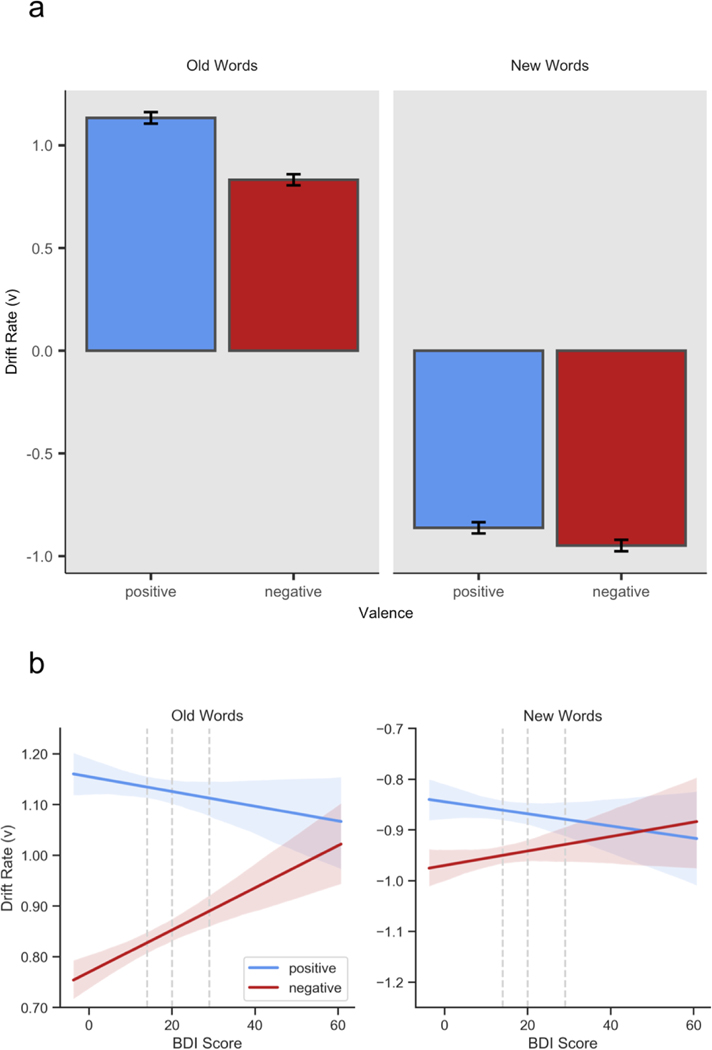
Figure 5.
HDDM drift rate estimates for the recognition data. Positive values indicate evidence accumulation towards an “old” response, while negative values indicate evidence accumulation towards a “new” response. In each panel, columns denote study status (left: old/studied words, right: new/unstudied words), and colors denote normative valence (blue: positive, red: negative). Error bars in panel (a) represent 95% HDIs. Error bands in panel (b) represent 95% bootstrap confidence intervals (Waskom et al., 2017). In Panel (b), dashed vertical lines denote standard cutoffs for mild, moderate, and severe depression. Panel (a) depicts more efficient evidence accumulation towards an “old” response for old positive vs. old negative words, but less efficient accumulation towards a “new” response for new positive vs. new negative words. Panel (b) demonstrates that as BDI scores increase, drift rate increases (towards an “old” response) for negative words but weakly decreases (towards a “new” response) for positive words, regardless of whether the word was actually old or new.

