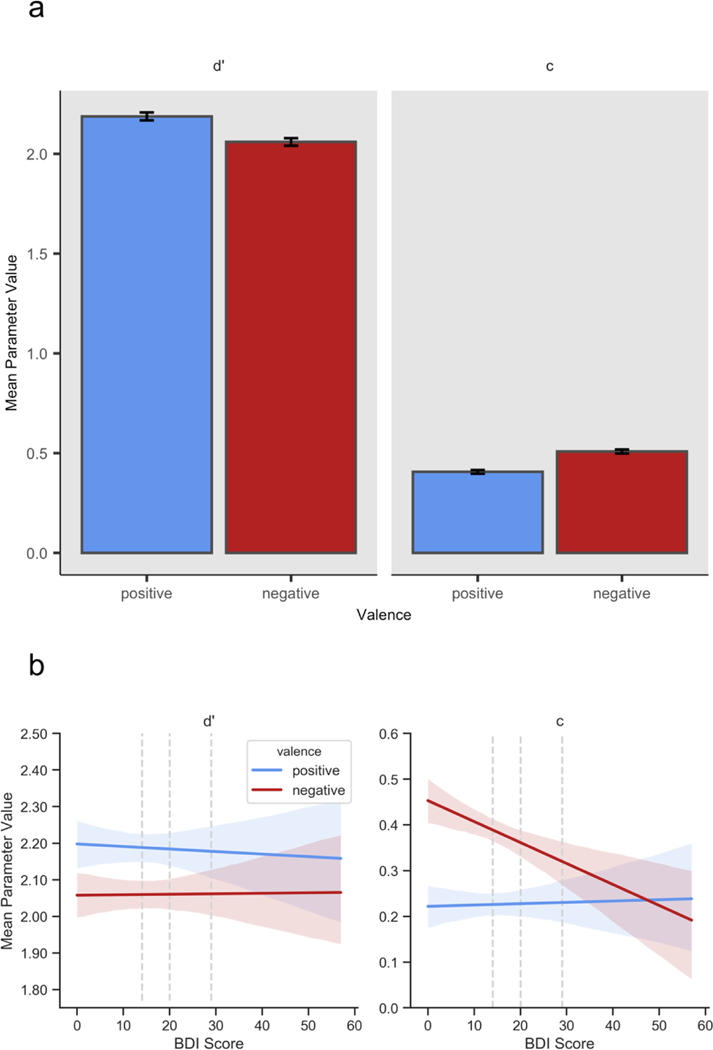
Figure 6.
SDT parameter values for the recognition data. In each panel, columns denote parameter (left: d’, right: c), and colors denote normative valence (blue: positive, red: negative). Error bars and bands represent 95% bootstrap confidence intervals (Waskom et al., 2017). In Panel (b), dashed vertical lines denote standard cutoffs for mild, moderate, and severe depression. Panel (a) depicts higher average values of d’ and lower (more liberal) average values of c for positive vs. negative words. Panel (b) demonstrates that as BDI score increases, d’ is unaffected but c decreases (becomes more liberal) for negative words.

