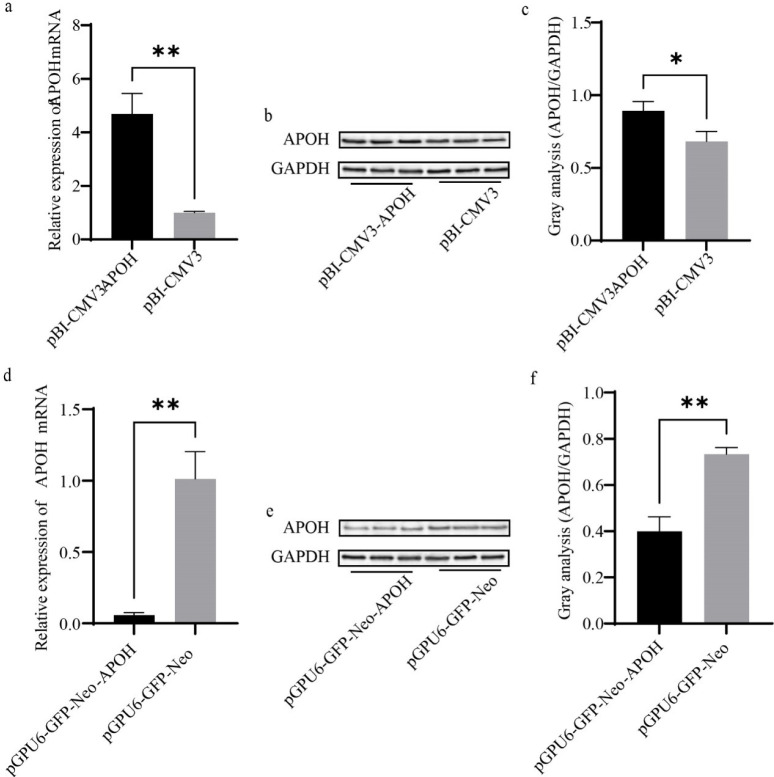
Fig. 3. The mRNA and protein expression levels of APOH in CS2s (n=3) after transfection with pBI-CMV3-APOH and pGPU6-GFP-Neo-APOH.
(a), (d) Relative mRNA expression levels of APOH in CS2s transfected with pBI-CMV3-APOH and pGPU6-GFP-Neo-APOH vectors. (b), (e) The indicated protein levels were detected by western blotting analysis. (c), (f) Relative folds of APOH (protein/GAPDH) from the western blots in (b), (e) were quantified by a greyscale scan. Data are the mean ± SD from three independent experiments. *p < 0.05, **p < 0.01. CS2s, duck myoblasts; APOH, apolipoprotein H; GAPD, glyceraldehyde 3-phosphate dehydrogenase.

