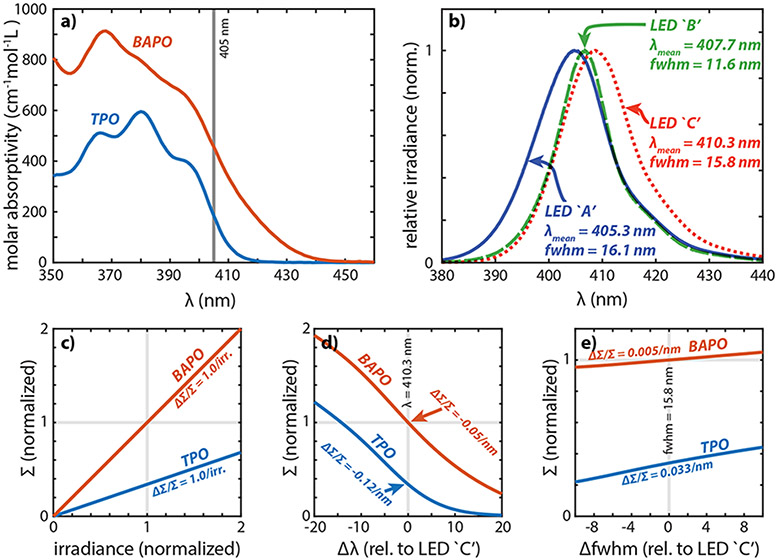
Figure 2:
(a) Molar absorptivity for two common photoinitiators in IPA. Note the BAPO solution had insoluble sediment observable and is thus considered to be a lower bound to the true values. (b) The spectrum of three randomly chosen nominally 405 nm LEDs. (c) The overlap integral (Σ) between the LED ‘C’ light source and the molar absorptivity which is used as a figure of merit (FoM) for photon absorption. (d) The overlap integral between the LED ‘C’ lineshape and the molar absorptivity for a range of center wavelengths (relative to the LED ‘C’ spectrum center wavelength of λ = 410.3 nm). (e) The overlap integral between the LED ‘C’ lineshape and the molar absorptivity for a range of linewidths (relative to the LED ‘C’ linewidth which has a full width at half maximum of 15.8 nm). The overlap integrals are all normalized to the as measured BAPO/LED ‘C’ value. Relative sensitivity of the FoM to irradiance, center wavelength, and linewidth are specified on each plot as ΔΣ/Σ.

