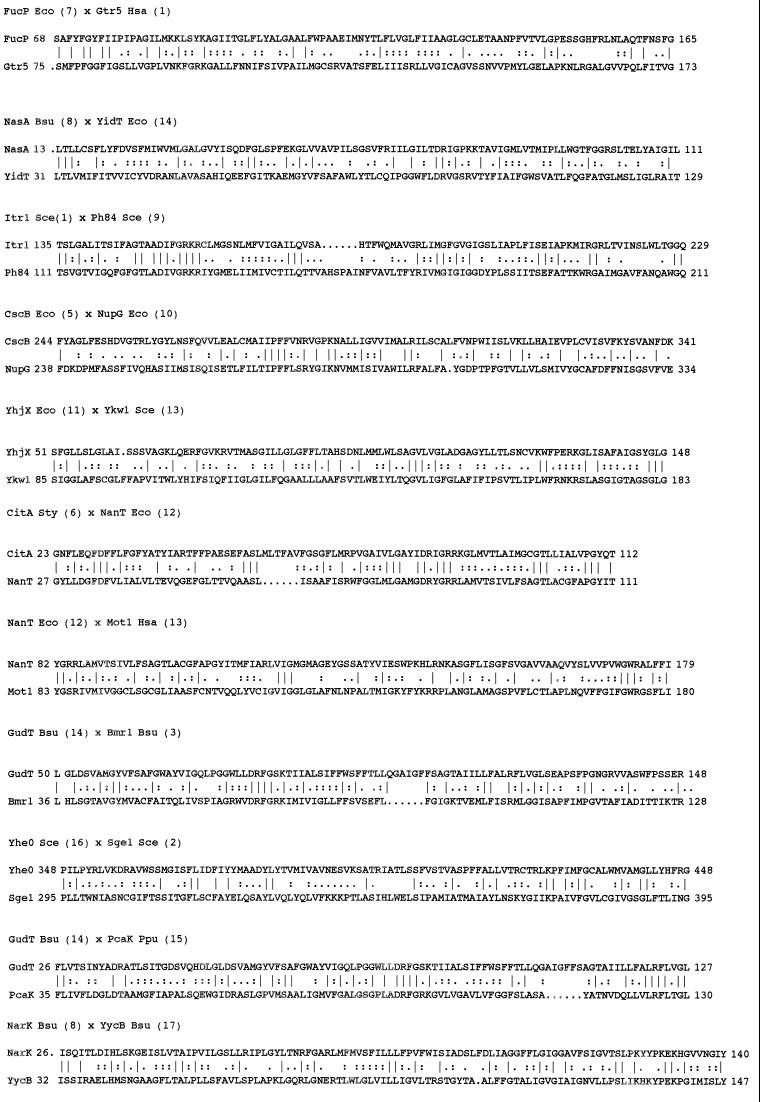
FIG. 1.
Interfamily binary alignments of representative regions within the larger alignments upon which the comparison scores recorded in Table 2 were based. The two proteins compared (families in parentheses) are presented above the alignment. Protein abbreviations are as indicated in Tables 3 to 17 for families 3 to 17, respectively. The number following the protein abbreviation and preceding its sequence is the residue number of the first residue shown. A vertical line specifies an identity, while double and single dots signify close and distant similarities, respectively.

