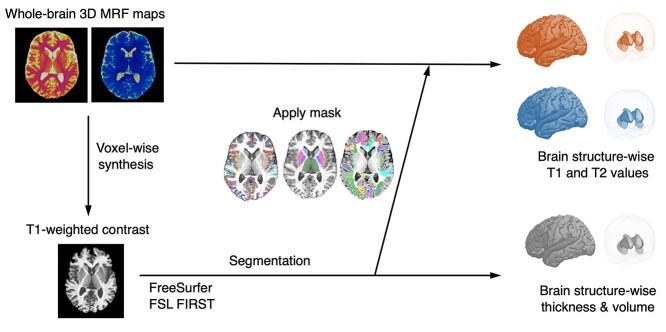
Fig. 1.
Schematic showing the postprocessing to calculate brain structure-wise T1, T2, cortical thickness, and subcortical volume values from 3D MRF maps. MRF-derived T1 maps are postprocessed voxel-wise to generate synthetic T1-weighted images (left). These MRF-derived T1-weighted images are imported into the automated brain parcellation software to generate subject-specific neuroanatomical parcellation (bottom). These subject-specific parcellation masks are directly applied to the T1 and T2 maps to obtain median relaxation times for each corresponding neuroanatomical region (top).

