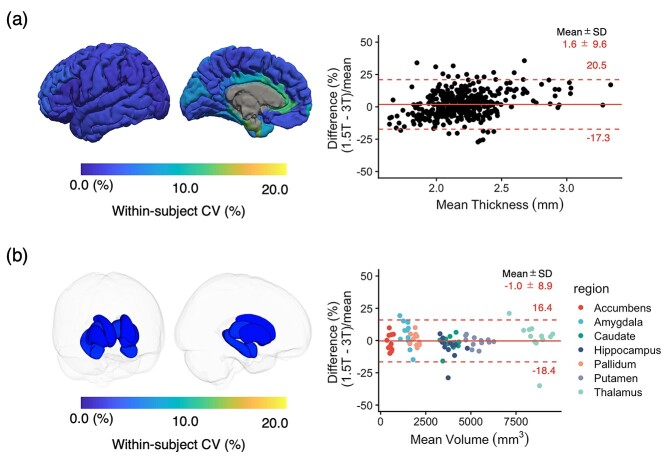
Fig. 5.
(a) Interfield-strength reproducibility of cortical thickness values. The scan-rescan wCVs of regional cortical thickness, T1, and T2 values are overlaid on an inflated brain surface. (b) Interfield-strength reproducibility of volumes of subcortical structures. Each subcortical structure is colored according to the regional wCV, and the brain surface is transparent for visualization purposes. The limits of agreement located at 1.96 × SD of the distribution are plotted as red dashed lines.

