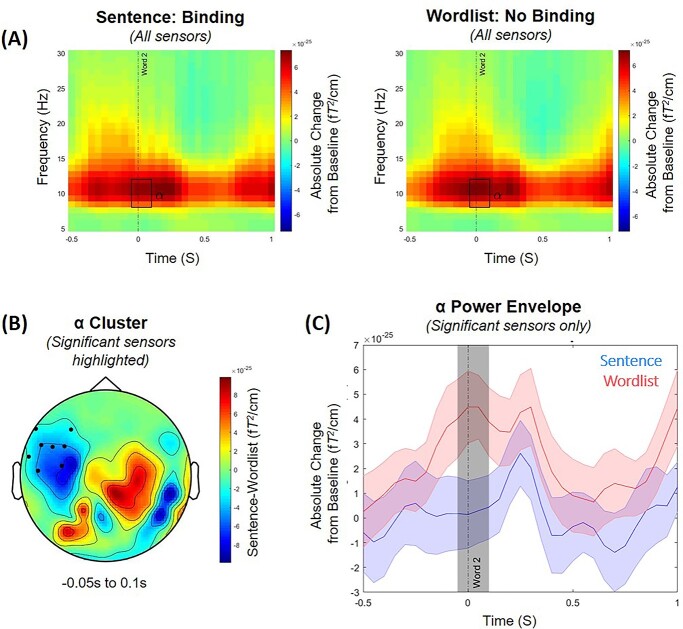
Fig. 2.
(A) Time–frequency representations of power averaged across all sensors, expressed as an absolute change from the baseline period (i.e. −2.1 to −1.6 s before the onset of the second word) for the sentence condition (left panel) in which syntactic binding was highly likely to occur (e.g. “she grushes”), and the wordlist condition (right panel) in which binding was highly unlikely (e.g. “cugged grushes”). Time relates to the main time period of interest aligned to the onset of the second word (at 0 s). The rectangle highlights the time period where we observed the significant difference in alpha power (8–12 Hz) between the 2 conditions (−0.05 to 0.1 s; P = 0.021). (B) The scalp topography of the condition contrast (sentence minus wordlist) of the averaged alpha power activity in the time window (−0.05 to 0.1 s) where we observed the significant difference in alpha power between the 2 conditions. The black dots illustrate where this effect was largest at the scalp level. (C) The time course of the alpha power envelope for the sensors showing a significant difference in power between the sentence (blue) and wordlist (red) conditions. The shaded colored areas represent the standard error of the mean. The shaded gray area indicates the time window in which the difference between conditions is significant, centred around the presentation of the second word (−0.05 to 0.1 s).

